
Benchmarking MHCflurry
16 May 2017 | by Tim O'DonnellWe recently released an update to MHCflurry, our package for peptide/MHC binding affinity prediction. At a high level, MHCflurry is distinct from existing software in this space because it is:
- Developed in the open and licensed under the Apache 2.0 license
- Usable as a Python library or from the commandline
- Installable with the standard Python package manager
- Reasonably fast
- Re-trainable: users can fit their own data
In this post I’ll describe the problem MHCflurry solves and illustrate one approach we’re using to compare its performance to the popular NetMHCpan tool. Our benchmark suggests that our latest release is still not quite as accurate as NetMHCpan, but we’re getting close.
Outline
Immunology background
T cells patrol the body and kill any cells whose proteins are “abnormal” – for example, cells that are infected by a virus or cancerous. How the T cells establish what “abnormal” means here is a fascinating question that’s at the core of adaptive immunity, but we won’t be going into that topic in this post.
Proteins are mostly inside cells, so the T cells need a way to see what’s in there. Evolution’s solution to this, devised about 500 million years ago, requires cooperation from the monitored cells themselves. The proteins in a cell are subject to degradation (for eventual recycling) by the proteasome, a machine that chops proteins into small fragments, called peptides. The immune system takes advantage of this recycling system by shuttling some of the chopped up peptides onto a protein called MHC. The stuck-together peptide and the MHC, known as the peptide/MHC complex, is sent to the cell surface where it can be inspected by T cells.
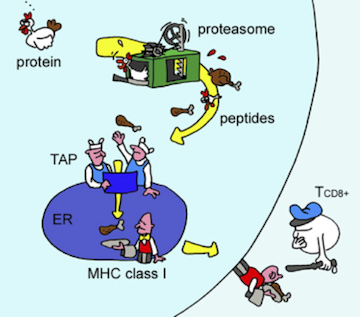 Antigen presentation. As proteins are degraded by the proteasome, some of the resulting peptides are trafficked to the endoplasmic reticulum (ER) where they are loaded onto MHC molecules and displayed on the cell surface. Figure from Yewdell, et al., Nature Reviews Immunology 2003.
Only a fraction of the peptides generated by the proteasome fit onto the MHC molecules, like a piece in a puzzle. This means that only certain peptides can elicit an immune response. What’s more, across the human population there are many variants (alleles) of MHC, each specific for a unique set of peptides. Thus the MHC-bound peptide repertoire (sometimes called the MHC ligandome) is in general different from one person to another.
When an MHC-bound peptide is recognized by a T cell, it’s called an epitope. Figuring out what the epitopes are in a protein is important in a lot of applications. For example, if you’re designing a vaccine to protect against a virus, it’s critical to include the epitopes from the viral proteins in the vaccine. Recently there’s been intense interest in understanding the epitopes arising from proteins mutated in cancer, known as neoantigens, since they seem to be responsible for much of the efficacy of immunotherapy.
Since binding MHC is a critical step for a peptide to be an epitope, many experimental techniques have been developed to determine whether an MHC molecule will bind a peptide. Purified peptides and MHC molecules can be assayed in vitro to measure how well they stick to each other, a quantity to known as binding affinity. Alternatively, peptide/MHC complexes can be stripped off cells and the peptides identified using mass spec. This gives a binary readout of the peptides bound to MHC. Experimental techniques like these have driven our understanding of immunology but require expensive equipment and specialized expertise.
Prediction algorithms
This is where machine learning tools like MHCflurry come in. MHCflurry is a collection of neural networks for predicting the binding affinity of a peptide and an MHC molecule. MHCflurry users can train predictors using their own affinity data (see the example notebook) or download models that we fit to measurements deposited in the Immune Epitope Database (IEDB). The latest MHCflurry includes 140 predictors, one for each MHC allele we support. Each of these predictors is an ensemble of 16 shallow artificial neural networks, themselves selected by grid-search over 160 model architectures. In total, we evaluated over 300,000 neural networks to generate the standard MHCflurry models, which required about 3.5 CPU years on Google Container Engine and motivated the development of Kubeface.
The standard tool for peptide/MHC binding prediction is NetMHCpan (Nielsen et al., Genome Medicine 2016), part of the NetMHC suite developed by Morten Nielsen’s group at Denmark Technical University. NetMHCpan is released as a closed-source binary that includes the model weights. The training data for NetMHCpan is not public; it uses the affinity data in IEDB combined with unspecified private data. Only the NetMHCpan authors can retrain it on new data. This makes it difficult to compare new predictors like MHCflurry against NetMHCpan, because one needs to generate an external validation set that NetMHCpan was not trained on, and NetMHCpan was trained on nearly all affinity data publicly available. An ongoing contest using data as it is submitted to IEDB enables some comparisons between tools but there are too few recent measurements for a reliable comparison.
Benchmarking with mass spec
Fortunately, recent advances have dramatically improved the accuracy and throughput of mass spec identification of peptides displayed on cell-surface MHCs. As we mentioned, in these experiments peptide/MHC complexes are stripped from cell surfaces. A mass spectrometer fragments the peptides into charged fragments, which are identified by their mass/charge ratio in a database search over the peptides present in human proteins. As this sort of data is not included in the training sets for MHCflurry or NetMHCpan, it’s a promising option to compare the performance of predictors trained on affinity data.
There’s a wrinkle, though. A mass spec result contains only positive examples – it’s a list of peptides that were found bound to MHC on a cell. Peptides not on this list could be missing for several reasons: proteins containing them may not have been expressed by the cell, the proteasome may not have cleaved them, or they may not have bound MHC. While it’s only the last case that constitutes a true negative example for our validation, from mass spec data alone we can’t differentiate these cases.
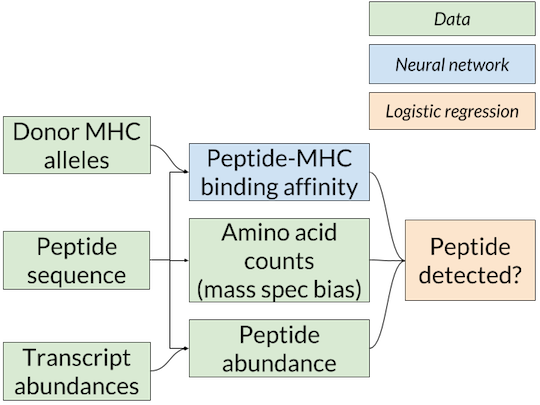 Nested-model scheme for benchmarking binding affinity predictors on mass spec data. A separate logistic regression model for each affinity predictor is trained and scored using that predictor’s affinity predictions. Since only the binding affinity predictor changes between logistic regression models, any differences in accuracy are due to the quality of the affinity predictions.
The solution we’ve adopted is the nested model shown above (similar to the one used in Abelin et al., Immunity 2017), in which the affinity predictions from MHCflurry or NetMHCpan are inputs to a logistic regression model that combines them with an estimate of the abundance of the peptide in the cell to give a final prediction on whether the peptide will be detected by mass spec. The abundance estimate comes from RNA-seq, which quantifies the messenger RNA present in a cell, and is thus a proxy for protein levels. We used RNA-seq from the cell lines used in the mass spec experiments or a similar cell type when this was not available. To train the logistic regression model, we choose random “decoys” from the proteome (not detected by mass spec) to constitute our negative examples.
Two technical notes: first, as certain amino acids (especially cysteine) may be under-represented in mass spec datasets due to their chemistry, we also include the counts of each amino acid in the peptide to the logistic regression model. This allows it to learn amino acid biases of the mass spec assay. Second, in other experiments, we have also incorporated proteasomal cleavage predictions, but the results do not change qualitatively so for simplicity we are omitting that from this post.
We evaluated four affinity models using this approach:
- NetMHCpan 3.0
- single-network MHCflurry models trained on IEDB (released in MHCflurry 0.0.8)
- ensemble-network MHCflurry models trained on IEDB (released in MHCflurry 0.2.0),
- an experimental MHCflurry model trained on mass spec (unreleased)
We’re including the last predictor as an interesting example of potential next steps. This predictor is trained on mass spec data, not affinity measurements like the others.
To train the logistic regression models (as well as the experimental mass spec-based affinity model), we used the mass spec hits published in Abelin et al., Immunity 2017 from a B cell line. We then scored the predictors on the four experiments in HeLa cell lines (each with a single MHC allele) from Trolle et al., Journal of Immunology 2016 as well as the peripheral blood mononuclear cells (PBMC) from Caron et al., eLife 2015. The training and testing data come from different labs, experimental conditions, and cell types. In this analysis we are considering only length 9 peptides, the most common length of MHC-binding peptides.
To score the predictors, we ranked all peptides in the proteome by the logistic regression model’s output, then calculated the positive predictive value (PPV) of the models at a very a stringent threshold (specifically, we calculated the fraction of the top N predicted-peptides that were observed in the mass spec hits, where N is the number of mass spec hits).
Results
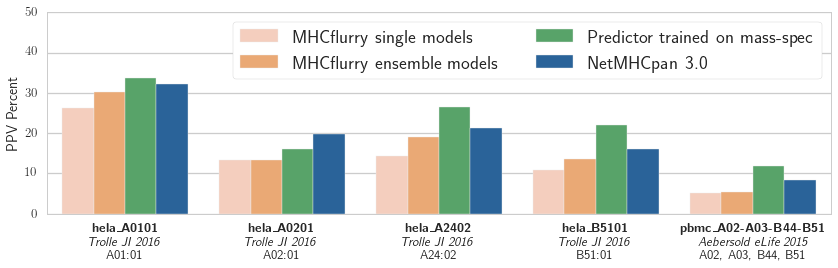 Positive predictive value (PPV) of the logistic regression models associated with each binding affinity predictor over five validation datasets from two publications. The training data was from the independent mass spec dataset published in_ Abelin et al, Immunity 2017
Our results are shown in the figure. The NetMHCpan-based predictor outperforms both MHCflurry predictors trained on IEDB data. We have more work to do! We also see that the experimental predictor trained on mass spec performs best. This is interesting, as the mass spec training data is smaller than the IEDB affinity data (about 1,000 mass spec hits per experiment compared to about 4,000 measurements in IEDB for each of these alleles). While some of this may be due to subtle biases in mass spec detection (which may be learned by the predictor), it’s encouraging evidence that relatively small amounts of mass spec data may enable a substantial improvement in affinity prediction.
Going forward, we are working on training MHC affinity predictors that can learn from both affinity measurements and mass spec data to make the best predictions possible. With any luck we’ll be updating you on those developments soon!