We went to Vancouver to present Ketrew and its younger sibling
Biokepi
at the OCaml 2015 workshop
(cf. video and slides).
As for many other projects, the talk deadline triggered a new release for
Ketrew a few days earlier:
2.0.0.
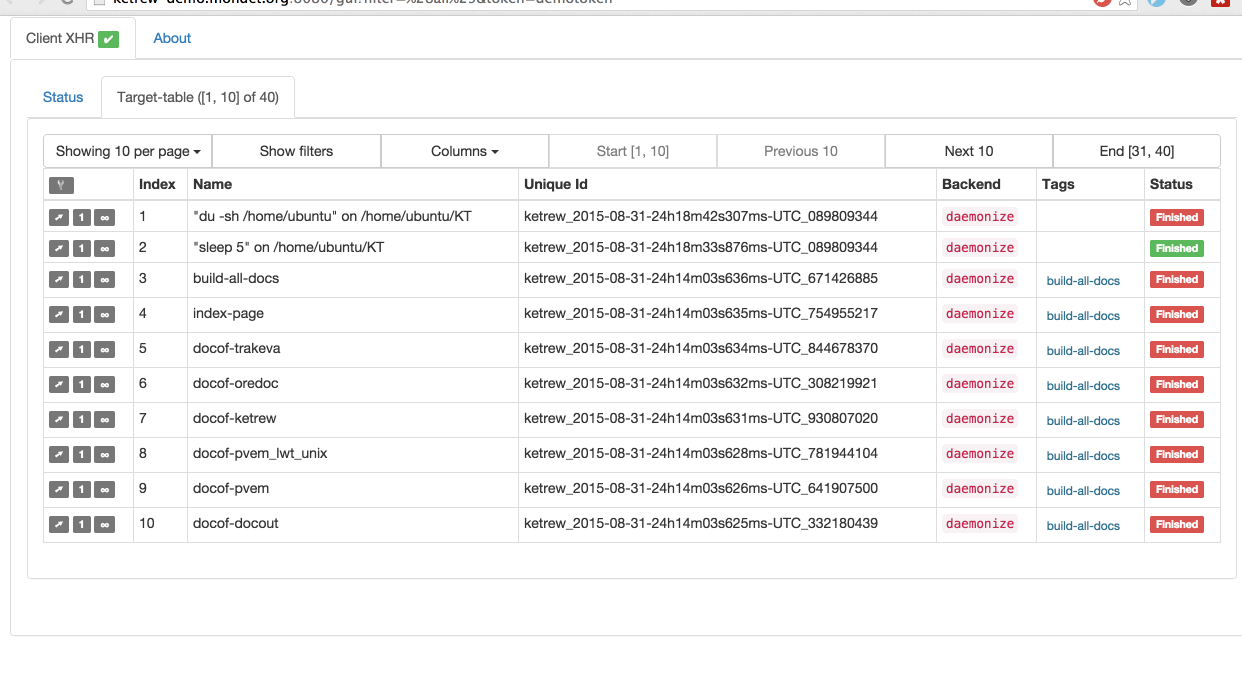
The main novelty is a WebUI, so we can be all webly and start by pasting a
huge animated GIF:
The new graphical interface fully runs in the browser
while sharing the same protocol as the Text-based UI
(cf.
protocol.mli).
It was written in about two months thanks to
js_of_ocaml.
We used Tyxml_js for
typed HTML5 tree manipulation within OCaml,
together with the react library
(the original one, not Facebook’s name-stealing “React”).
Overall, going on a programming spree with Tyxml_js + React
has been a
really fun and pleasant experience.
It’s
difficult to believe that some people in the world build reactive UIs
without a decent type system.
This release comes with a few other miscellaneous changes:
We made it easier to get started:
We made the command ketrew init much more clever: it can create much
more complex ready-to-use configuration files.
We added the option to run the HTTP server without TLS.
We wrote a more accessible “Getting Started”
documentation.
We improved the YARN backend (incl. talking a bit with its HTTP API).
We took the chance to do some backwards incompatible changes to the EDSL API
since other changes were already triggering a major version change.
The next release will be coming soon, with many backwards compatible changes.
Ketrew, through Trakeva, will be able to use other database
backends for the configuration file (currently PostgresQL
is being stress-tested). One can also backup and synchronize between database
backends.
Much better scalability of the engine and WebUI.
Parsable and searchable logs for admins.
More configurability for the WebUI.
We have been using Ketrew 2.0.0 with Biokepi for a while now,
and would appreciate help breaking it!
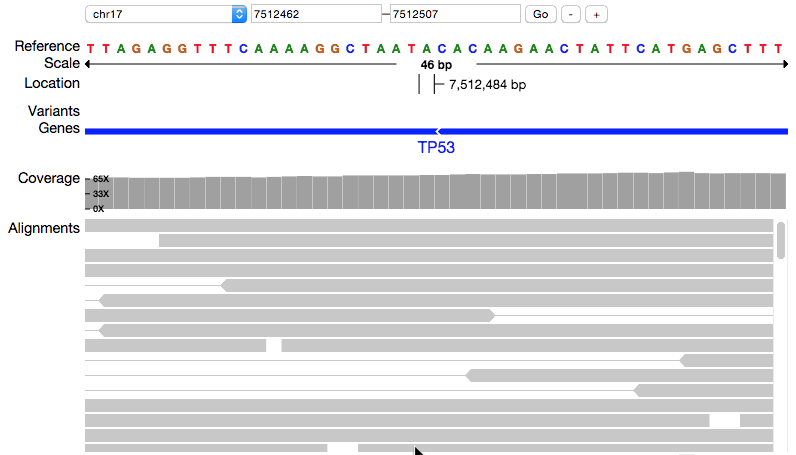
Modern web browsers provide two main APIs for graphics: SVG and canvas. The relative merits of these two technologies have been discussed at length. We’d like to add our experiences with pileup.js to the conversation. In this post, we’ll explain why we chose to migrate from SVG/D3 to canvas and look at the data-canvas library we built to ease the transition.
pileup.js is a library for visualizing and exploring genomes in the browser:
When we introduced it three months ago, we touted the merits of SVG:
By using SVG, we allow the tracks to be styled and positioned using CSS. This facilitates complex layouts and is more approachable for web developers than custom styling systems.
Styling with CSS is one advantage of SVG but there are others:
It’s easy to test: you can use querySelector to find SVG elements and assert that they have certain properties.
It’s inherently resolution independent, a big plus in the age of retina displays.
While we were generally happy using D3 and SVG, we weren’t altogether happy with the performance of pileup.js. Its frame rate while panning was noticeably worse than other genome browsers like Dalliance and IGV.
As an experiment, we rewrote a subset of the pileup track using canvas instead of D3/SVG. We didn’t try to do anything clever: on every frame we cleared the canvas and redrew the entire scene from scratch.
A few things struck us about this:
The canvas code was considerably simpler than the D3 equivalent. Whereas D3 required elaborate keying and joining to keep our data and visualization in sync, the canvas code was stateless. It simply took data and drew a scene.
Because the Flow type checker has canvas declarations, it was able to provide significantly better static analysis than it did for the D3 code, for which declarations do not exist.
The CPU profile showed a dramatic performance win. The D3/SVG pileup track had been the biggest CPU hog, using about 30% of cycles while panning. After migrating to canvas, it only used 2% of cycles. Migrating to canvas was a 15x speedup! This matches the experiences of other developers, who have found canvas to be between 10x and 200x faster than SVG.
In the face of a 15x performance win, our arguments for SVG no longer held much water: we needed to switch to canvas.
Switching to Canvas
To ease this transition, we set out to find libraries that made up for canvas’s drawbacks, e.g. difficulty in styling, testing and click-tracking.
There are manylibrarieswhichwrap the canvas tag in something a bit more stateful. For example, fabric exposes Rect and Circle classes which get rendered onto the canvas.
Mapping our data objects into a permanent hierarchy of visual objects would require a different coding style, however. This is essentially what D3 does with its joins and selections. We wanted to preserve the simple character of the native canvas code.
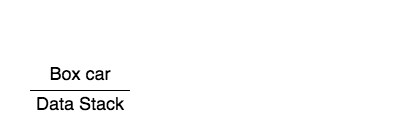
These maintain a stack of objects which are currently being rendered. We call this the “data stack”. Here’s what the stack looks like for a simple drawing:
While each object is being rendered, it sits on the data stack. Since re-rendering whole scenes is cheap on a canvas, we can easily perform other useful functions in the data stack while it renders objects by swapping in custom “contexts”:
A context which records all calls allows us to write tests which assert that particular objects or shapes were drawn to the canvas (rather than checking the color of individual pixels).
A hit-testing context allows us to determine which objects were on the stack when a particular point was filled or stroked. This makes it possible to determine what was clicked.
Check out the data-canvas README for a tutorial and a more in-depth treatment of this approach.
Results
After migrating all of our visualizations from D3/SVG to canvas, we were able to achieve a roughly a 5x improvement in frame rate while panning. We found the resulting code to be simpler than our D3 code, with less need to build temporary data structures and keys for use as D3 data.
While we’re happy with the improved speed of our visualization and clarity of our code, there are still some shortcomings of this approach:
As we continue developing data-canvas, we hope to find solutions to all of these.
If you’re using canvas in your web application, please give data-canvas a try. Please visit the github repo, file issues in its issue tracker and ask us questions on its gitter channel.
Here at the Hammer Lab we have a well documented focus on
testing
as an important component of good software engineering.
For our open source projects, we selfishly want to encourage test writing because it helps with adoption.
Oml is no different but presented some novel challenges and experiences that we’d like to share.
Challenges
Writing a test suite for a general numerical library poses a set of unique questions.
How do you make your tests comprehensive?
One unit test
matching a specific input to a specific output is fine,
but writing a sufficient number of such cases will not scale.
Furthermore, the actual input domain, which is usually the set of floats, is huge and contains such special cases as nan,
infinity and neg_infinity.
A natural solution is to use property-based testing like
QuickCheck.
But choosing appropriate properties for algorithms that essentially encode
non-linear functions is not trivial.
Specifically, fixed points limit the range of values that you test.
Furthermore, testing higher-order relationships between functions can require more
complex algorithms than the functions to be tested, and hence introduce another source of error.
Within these tests one wants to avoid probabilistic failures due to
floating point computations.
Example
To make the example concrete, consider testing a univariate linear regression algorithm.
Regression takes as input two arrays of floats: the independent and dependent variables.
We can write a specific unit test:
module U = Regression.Univarite;;
let independent = [| 1.0; 2.0; 3.0 |] ;;
let dependent = [| 2.0; 4.0; 6.0 |] ;;
let r = U.regress None ~pred:independent ~resp:dependent ;;
assert (U.alpha r = 0. && U.beta r = 2.0) ;;
This is the solution that will not scale.
We can think of specific independent/dependent array pairs where we know the
generating linear model:
let p = 3.0 (* Some well behaved float that we know. *) ;;
let independent = [| 1.0; 2.0; 3.0 |] ;;
let dependent = Array.map (( *. ) p) independent ;;
let r = U.regress None ~pred:independent ~resp:dependent ;;
assert (U.alpha r = 0. && U.beta r = p) ;;
But this solution isn’t much better because it doesn’t challenge the realm of
possible use cases for these methods.
We can try and test a “higher-order” relationship:
let independent = [| 1.0; 2.0; 3.0 |] ;;
let dependent = [| 2.0; 4.0; 6.0 |] ;;
let r = U.regress None ~pred:independent ~resp:dependent ;;
let t = 2.0 (* Some well behaved float that we know. *) ;;
let independent2 = Array.map (( *. ) t)  [| 1.0; 2.0; 3.0 |] ;;
let dependent2 = Array.map (( *. ) t) [| 2.0; 4.0; 6.0 |] ;;
let r2 = U.regress None ~pred:independent ~resp:dependent ;;
assert (U.alpha r = U.alpha r2 && U.beta r = U.beta r2) ;;
But finding these relationships isn’t always obvious and isn’t necessarily better
than trying to test the algorithm directly:
let independent = Array.init 100 (fun _ -> Random.float 1e3) ;;
let alpha = Random.float 1e3 ;;
let beta = Random.float 1e3 ;;
let dependent = Array.map (fun x -> beta *. x +. alpha) independent ;;
let r = U.regress None ~pred:independent ~resp:dependent ;;
assert (U.alpha r = alpha && U.beta r = beta) ;;
But this simple example will most probably not pass because there is no
guarantee that our inputs are “well behaved” and there are no rounding errors.
This leads to one of the main problems that our test suite will deal with: imprecise floating point calculations.
How do you express floating point dependencies between functions?
How do you order the testing and convey that if a function has certain properties,
then functions that depend on it will have derived properties?
For example, it is well known that Newton’s method
has quadratic convergence; it doubles the number of computed significant digits
at each iteration.
If we were to use this solver to compute a special irrational constant
(for example the Golden Ratio, a root of x^2 - x - 1),
that accuracy of the constant would dependent quadratically on the number of iterations.
This would change if we were to use a different method.
Furthermore, what if the point of the algorithm is to test specific, refined behavior such as faster convergence or more precision per operation?
For example, the module that measures means and standard deviations
has different performance characteristics than the online versions.
How do the tests fit into the codebase?
Although this question is common to all software projects, it posed interesting concerns.
We want the tests to be distributed with the source code, but obviously not built with the library.
At the same time we want flexibility.
A test could target any part of the code,
specifically, internal private functions that may not be exposed as a part of the public interface,
but might be the crux of the algorithm that we want to test.
Choosing a framework
We surveyed the available options for testing in OCaml and assembled some brief notes:
OUnit: assertion-based testing along the lines of JUnit.
Pro: Lots of different assert logic.
There are included frameworks for logging, configurations, runners, and setting up and tearing down.
Con: Limited to testing the exposed API; what if you want your test to access internal functions?
There are other pieces of software available but they either did not seem like
full-fledged libraries that could satisfy our demands, or they were not
available when we had to make a decision:
Property-based testing, as previously described, is a natural fit for many of
the tests of the functionality of this library;
this requirement eliminated Pa_test and OUnit.
While powerful, coding with inline commented pragmas seemed an inflexible solution, so iTeml was eliminated.
QCheck seemed like it would be simple to use but the lack of documentation and examples was concerning.
The blending of both property-based checking with simple assert logic into one framework led us to choose Kaputt.
Setup
Setting up the testing proved to be interesting to say the least;
our solution is a local maxima constrained by
ocamlbuild
idiosyncrasies and developer patience.
The Kaputt documentation
recommends that a separate foo.mlt file is kept with test code for foo.ml.
The test is afterwards concatenated to the original source code via a preprocessing step.
This seems like a flexible solution to writing both original and testing code.
To control whether we’re building a test or the regular library we added a .test target to
ocamlbuild via a plugin.
The plugin makes sure that the .mlt test files are copied over to the ‘sanitized’ build
directory of ocamlbuild.
We changed Kaputt’s default preprocessor to modify the original .ml file in place via
joiner.ml
so that our code coverage would pick up the right filename.
The joiner also utilizes an OCaml
directive to separate the original source code from the testing source code:
starting a line with # 1 "new_name.ml" changes the lexing buffer to new_name.ml.
This ensures that compilation errors are correctly traced back to the test .mlt file.
We also wrap the test with bisect ignore comments (*BISECT-IGNORE-BEGIN*)
and (*BISECT-IGNORE-END*) to have accurate measures of code coverage.
Lessons learned
Effectively testing this library has been a learning experience.
While most tests represent legitimate mathematical properties,
the nature of floating point computation turns these deterministic properties
into probabilistic ones; for example,
when run 100 times, this test case
occasionally (but routinely) fails because of floating point rounding.
The nature of the problem is such that it is often not obvious which step of the test is
causing the lack of precision.
Using means or multiple comparisons might be less precise than the algorithm you’re testing.
Controlling these probabilistic failures has turned into a balancing act.
On the input side we can (and do) restrict the size
of input values, while on the output side we can fiddle with how many
significant digits
we use to compare floats.
We have tried to be principled about this approach
by explicitly failing to generate float values without a developer-specified bound.
These bounds imply an interesting characteristic of numerical algorithms;
namely a volume for acceptable input/output pairs.
Consider a small list of these parameters:
The upper bound on random float generators taken as input to the test, e.g,
bfloat 1e10
The number of digits we can compare of the outputs, e.g. 3 in equal_floats ~d:1e-3
The size of input array, e.g. 100
Treating these parameters as sides of a box: if we compare two algorithms that do the “same” thing,
and we fix a pass rate (e.g. 99%) for these boxes/tests,
we want the one with the bigger volumes.
Numerically determining these values is an area of future work.
Kaputt has an interesting Specification
API; it allows a richer mapping between input to
output.
This is a powerful mechanism that we are just learning to use.
Unfortunately, it is not clear how to specify a failure rate to address the first lesson
or to specify a relationship between input sizes and output comparisons from the second lesson.
You won’t see this in the code base or documentation,
but property-based testing is highly effective at catching bugs in this domain.
We’d like to announce a library, Oml, that is a small attempt to fulfill a big need:
numerical computing in OCaml. For a long time, people have been successfully
using OCaml for numerical work, and many libraries have been written that either
wrap existing functionality:
Lacaml and SLAP for vector, matrices and linear algebra routines,
But a simple unified library with the middle pieces has been missing.
Origins
To understand Oml, it might be helpful to know about its origin.
Oml started as a collection of scripts and routines for exploratory data analysis
that developers found themselves reusing between projects.
Some have a personal preference for developing software and data projects by using a REPL;
it provides an iterative feedback loop that allows one to make lots of mistakes quickly
and thereby learn.
Unlike more traditional, interpreter-based systems that are not statically typed
(ex. R, Matlab, and Python) the OCaml REPL
lets you also model the problem domain with types.
So we can have a little bit more confidence that crazy code such as
is doing the “right” thing when it confirms that the type is a float array array.
We needed a library that would fit this workflow.
The second need is when we start modeling the data by running regressions or
creating classifiers, we don’t want to turn to a statistics textbook or Google to
understand the procedures for these methods in detail.
It is at this moment that a type system can be particularly helpful because
it specifically encodes the different possible analyses and their
required parameters.
Here is a quick tour of some of Oml’s capabilities.
These examples were performed in the utop REPL (and edited for readability),
so to get started
I also added these commands to make the examples easier to see
First let’s demonstrate Oml’s Sampling
capabilities by generating some data from a fat-tailed distribution,
using a method that is easier to understand than resorting to a specific distribution;
mix two normal distributions
with different variances.
In the data below, every 10th data point is from a normal distribution
with standard deviation of 10 while all the rest have a standard deviation of 1.
Let’s investigate it
unbiased_summary deals with sample size adjustments, such as dividing by n-1 for standard deviation.
The `Fat should raise some concern for the keen data analyst, but it is by design.
The `Negative skew might draw more questions, but repeating the analysis can shed light
on this “balancing” problem; consider
The function data_skew uses the same technique to generate our data but takes as argument the frequency of when we sample from the
wider (std=10) distribution.
Afterwards, count_big_skew summarizes samples of data,
counting those where the skew classification
is `Positive or `Negative.
Finally, we compare two cases;
one where we generate samples of data from the wider distribution on every 10th draw,
and one where we alternate.
Two sample runs demonstrate that skewed samples are much more frequent
when drawing from the wider distribution is rarer.
Another way to think about this effect is that the distribution is so leptokurtic
in relation to the other moments that it dominates.
Since we knew that the original data is supposed to have a mean of 2.0 we can ask for the probability of observing
this data via an Inference test.
So we shouldn’t be surprised by our data.
Lets demonstrate a simple regression.
What if we throw some collinearity in the mix:
As we can see, regular regression gives us back some pretty outrageous coefficients : [|-80174210710646.3594; -80174210710645.5156; 80174210710652.8594|].
But when we use ridge regression,
even a small lambda of 0.1 helps us recover more sensible coefficients [|1.8613; 2.7559; 4.6172|].
Furthermore, Carmelo Piccione provided valuable
contributions and code reviews.
Future Work
While we think of Oml as a work in progress, we want to release it to the general public
to garner feedback.
Writing a powerful and flexible library is going to take a community effort
because developers have different interests and strengths.
Furthermore, while one function name or signature may be obvious to a developer,
it may be confusing to others, so we encourage feedback through the issue tracker.
In the immediate future, we’d like to:
Refactor the testing framework to have uniform float
comparison
and perhaps formalize the probabilistic properties.
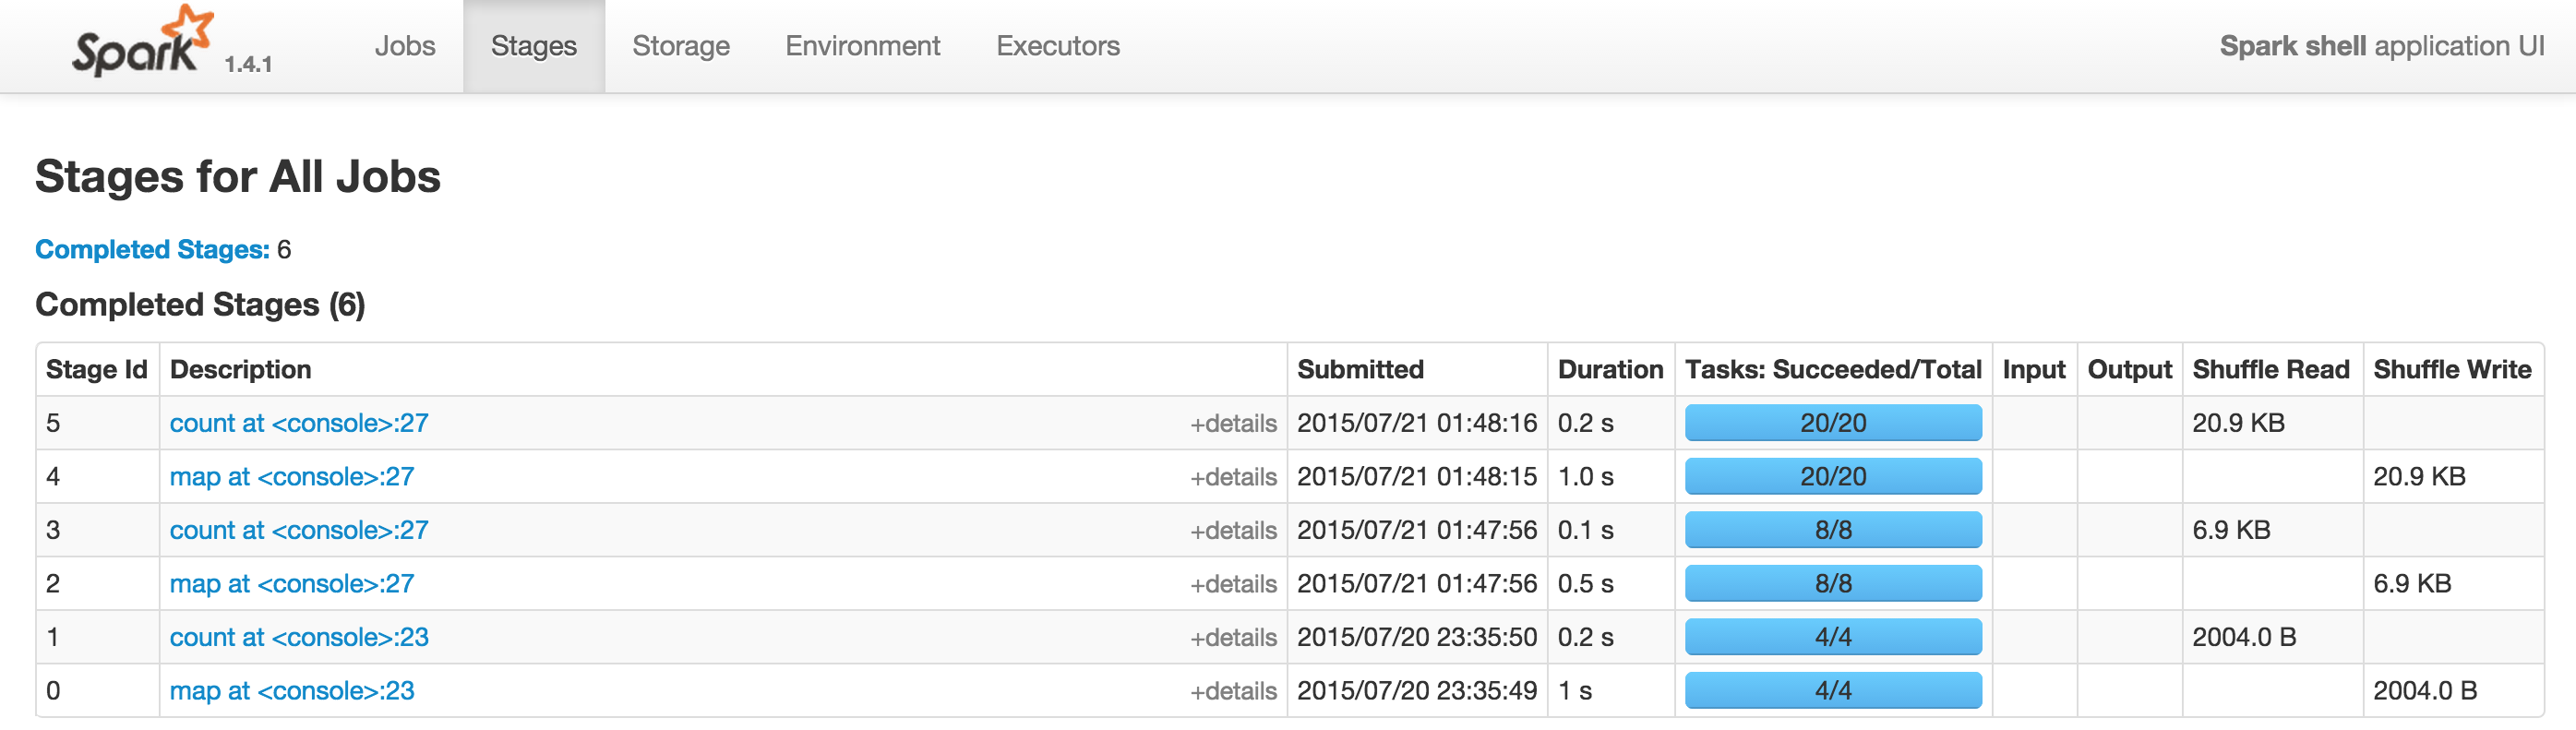
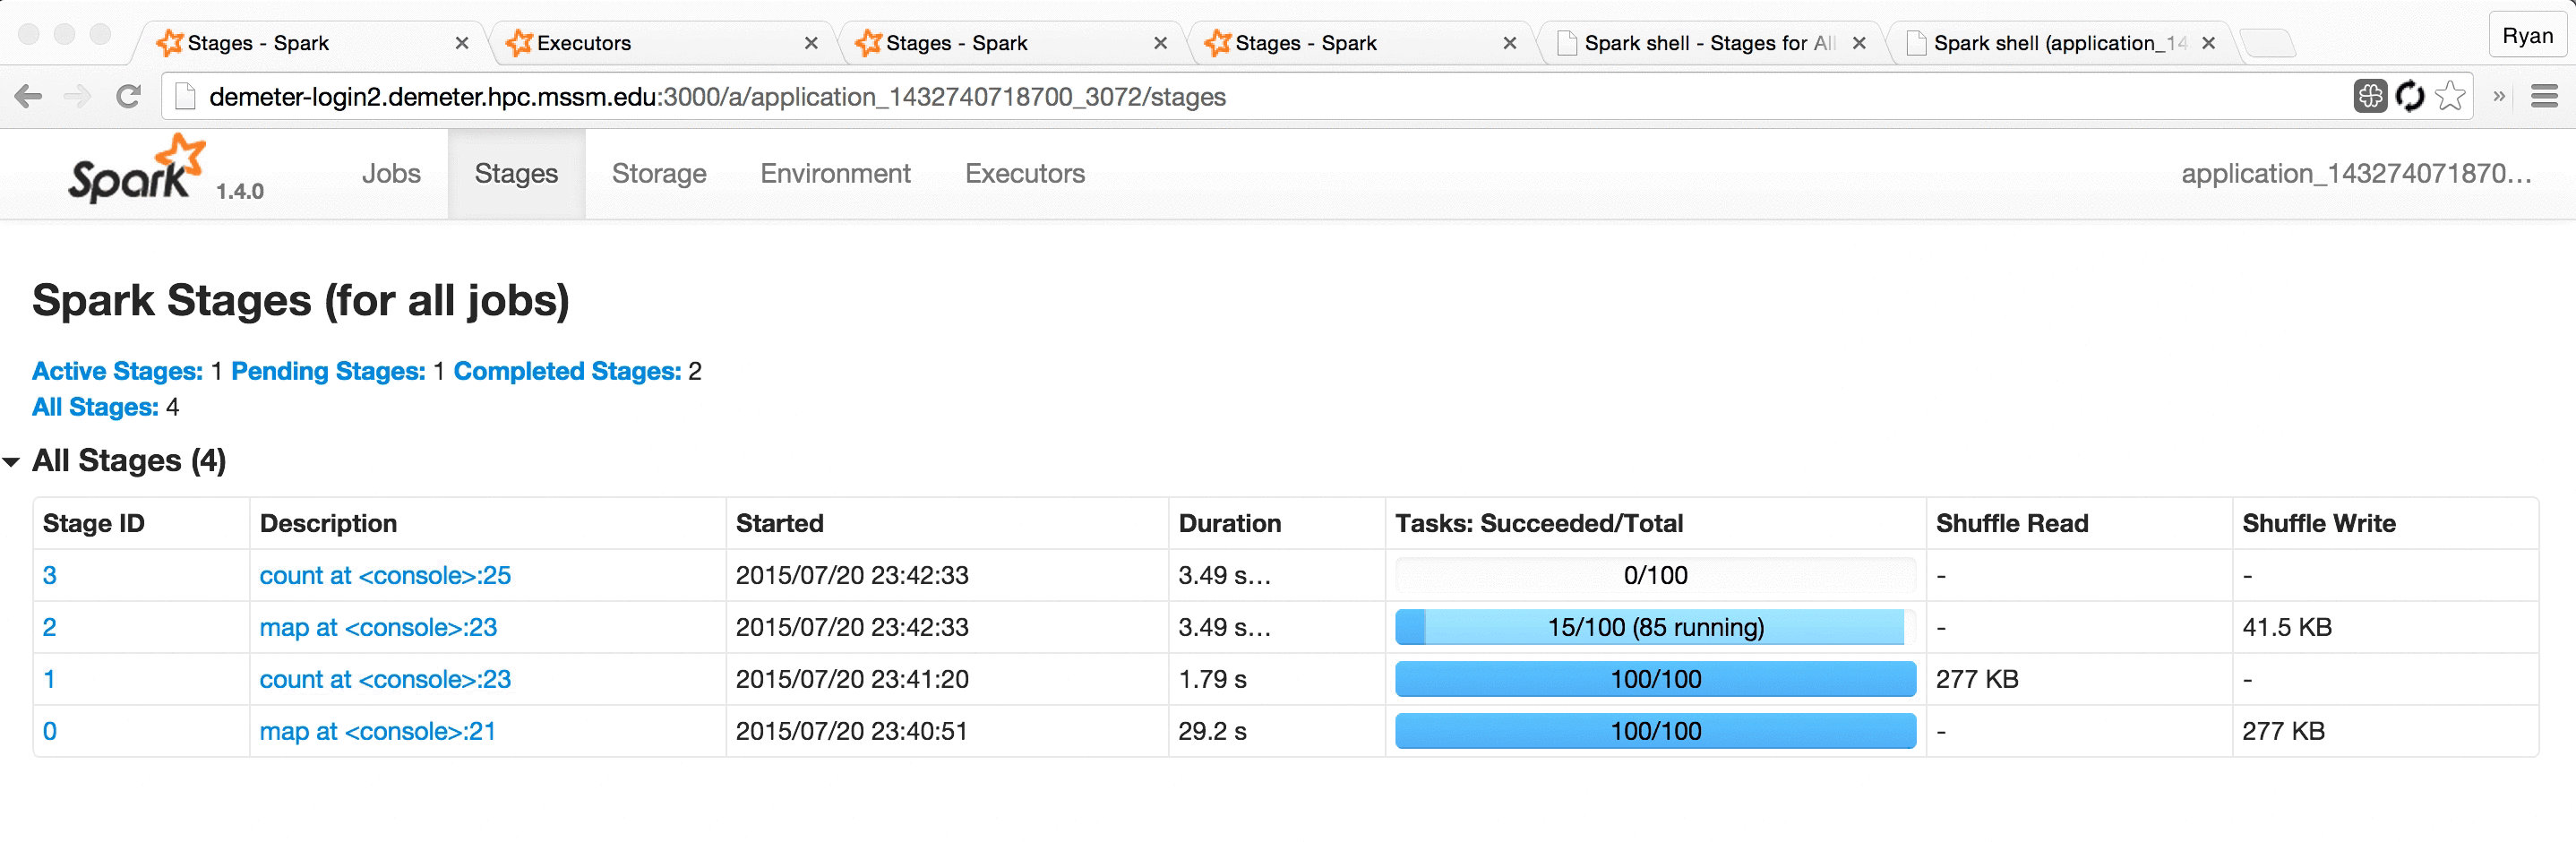
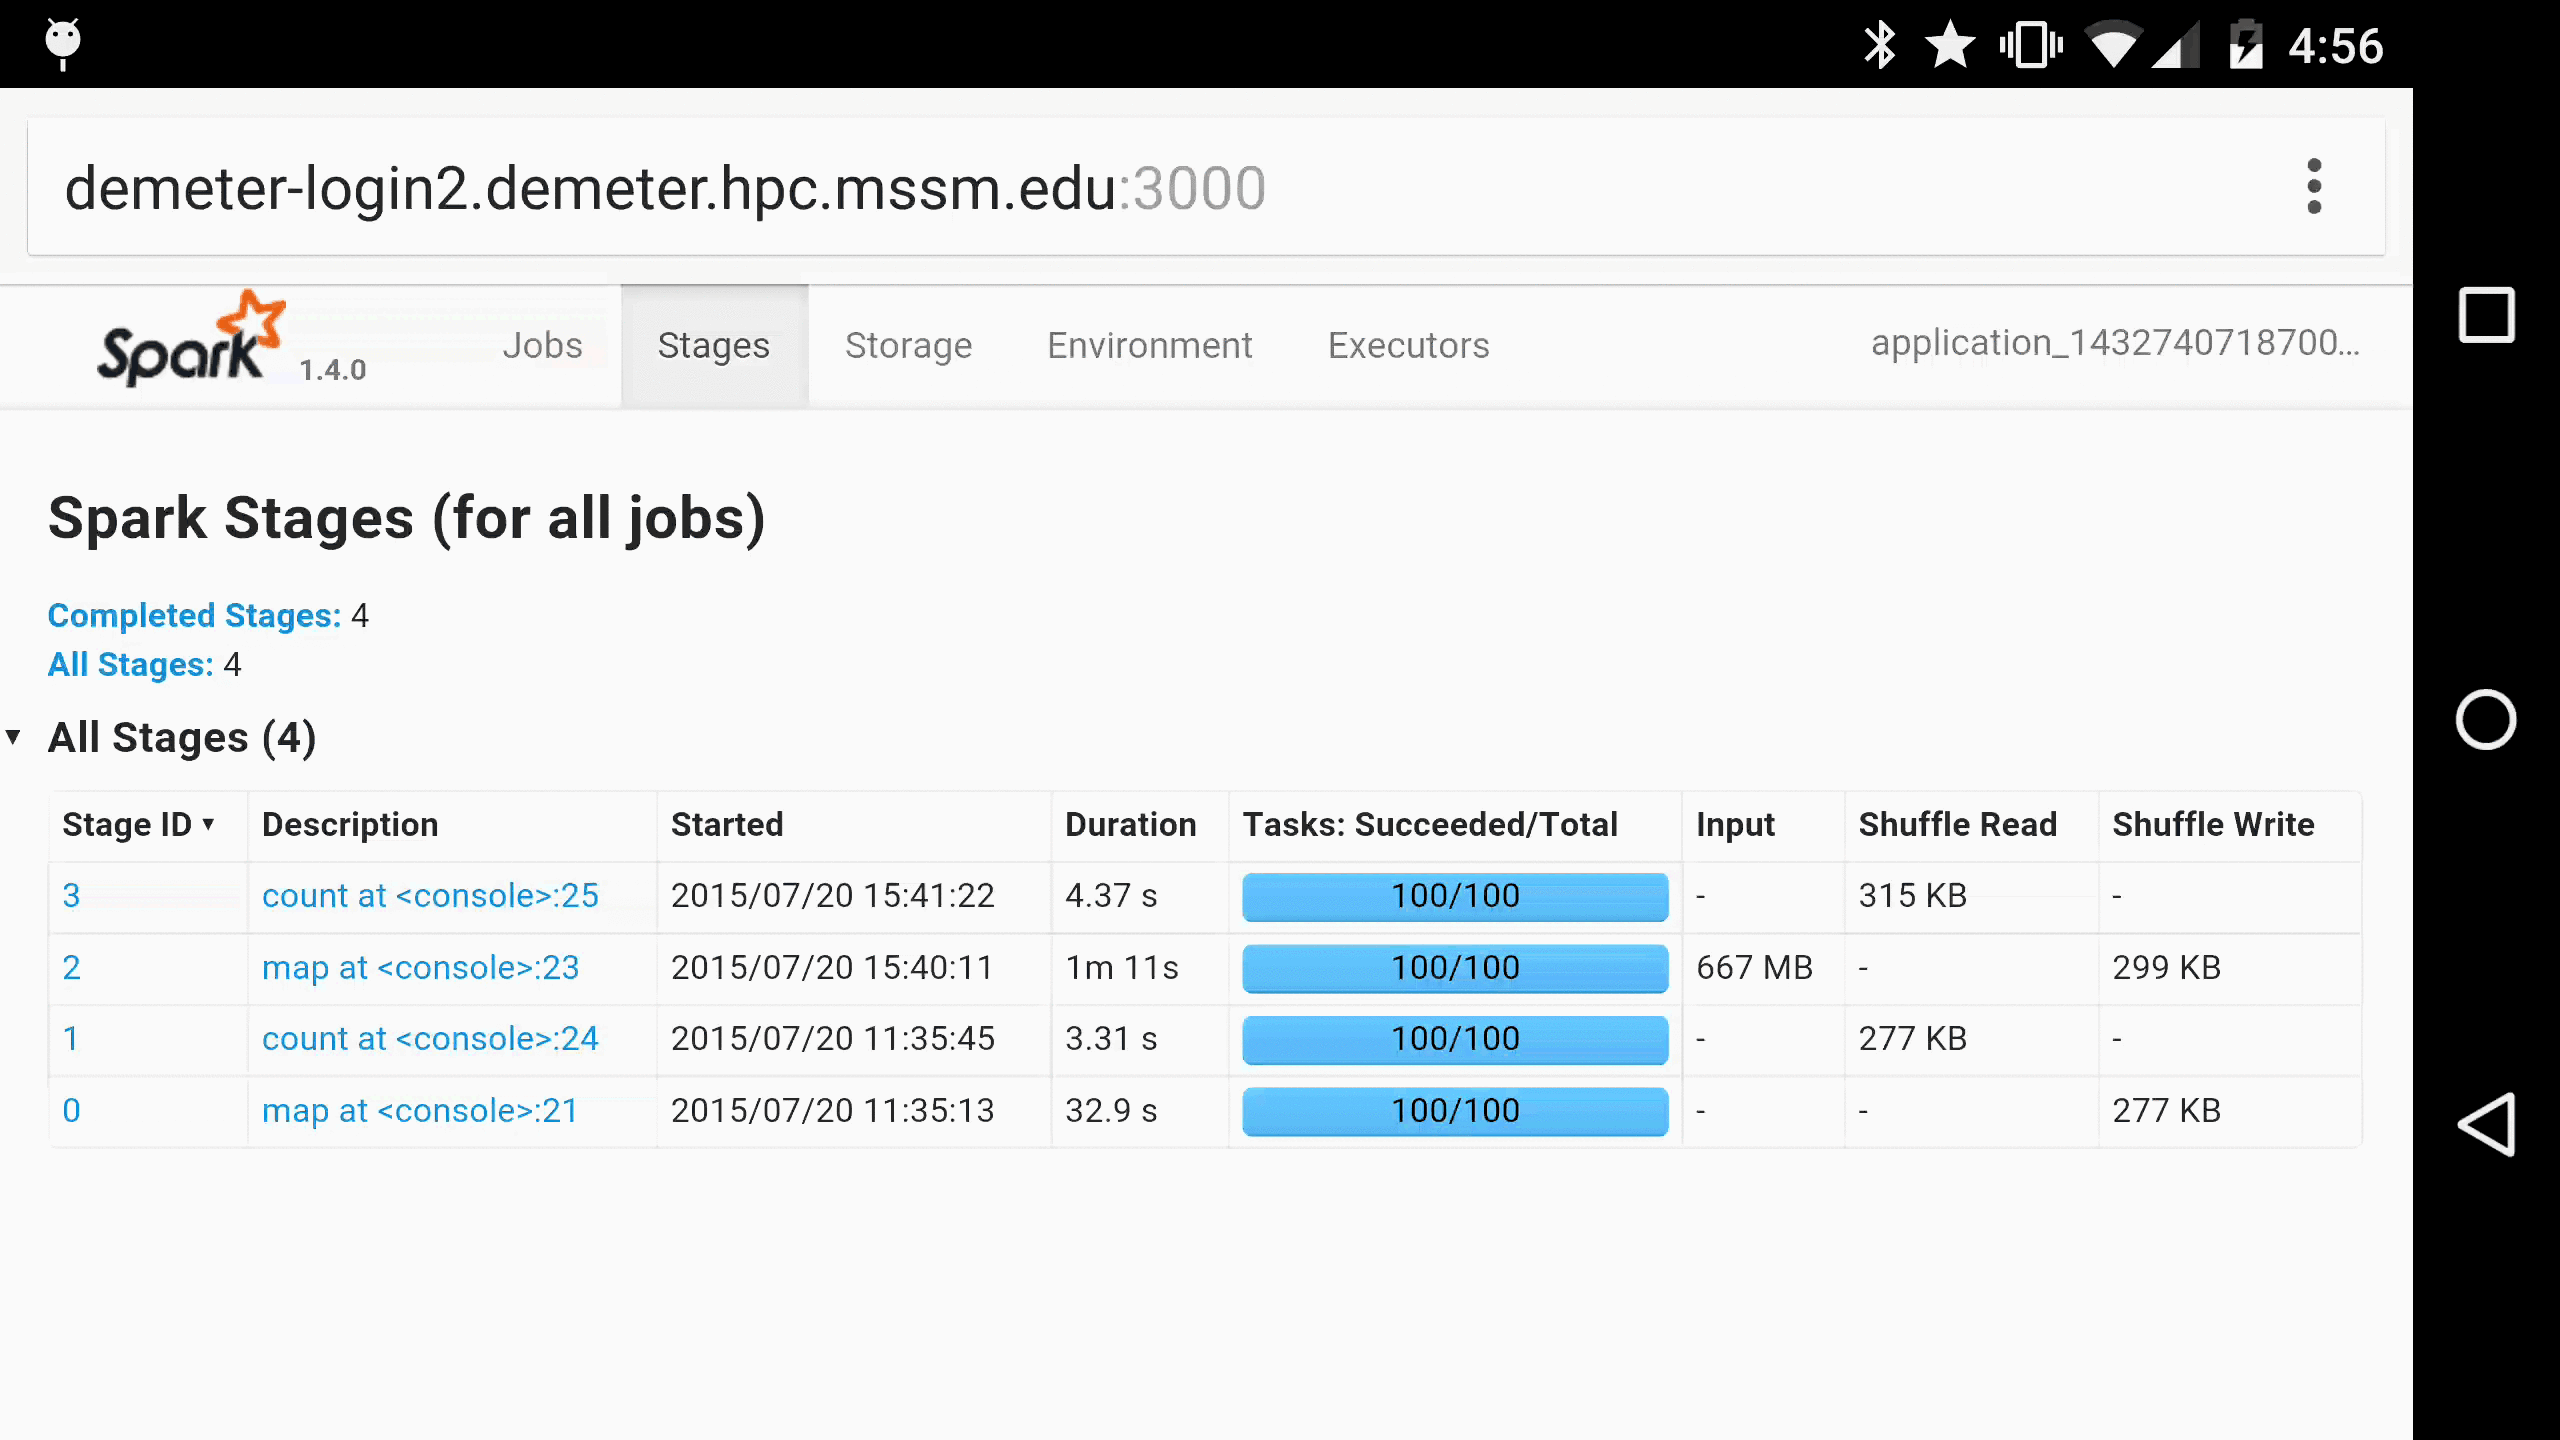
At Hammer Lab, we run variousgenomicanalyses using Spark. Most Spark users follow their applications’ progress via a built-in web UI, which displays tables with information about jobs, stages, tasks, executors, RDDs, and more:
This UI offers a wealth of information and functionality, but serious Spark users often find themselves refreshing its pages hundreds of times a day as they watch long-running jobs plod along.
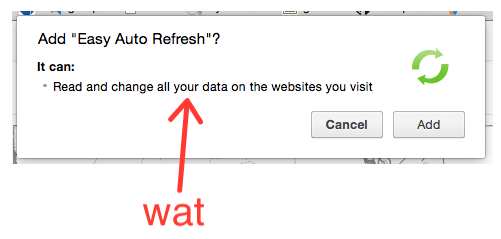
Some even use Chrome extensions like Easy Auto-Refresh to force the page to refresh every, say, two seconds. This mitigates the problem somewhat, but is fairly clumsy and doesn’t provide for a very pleasant user experience; the page spends a significant fraction of its time refreshing and unusable, and the server and browser are made to do lots of redundant work, slowing everything down.
Enter: Spree
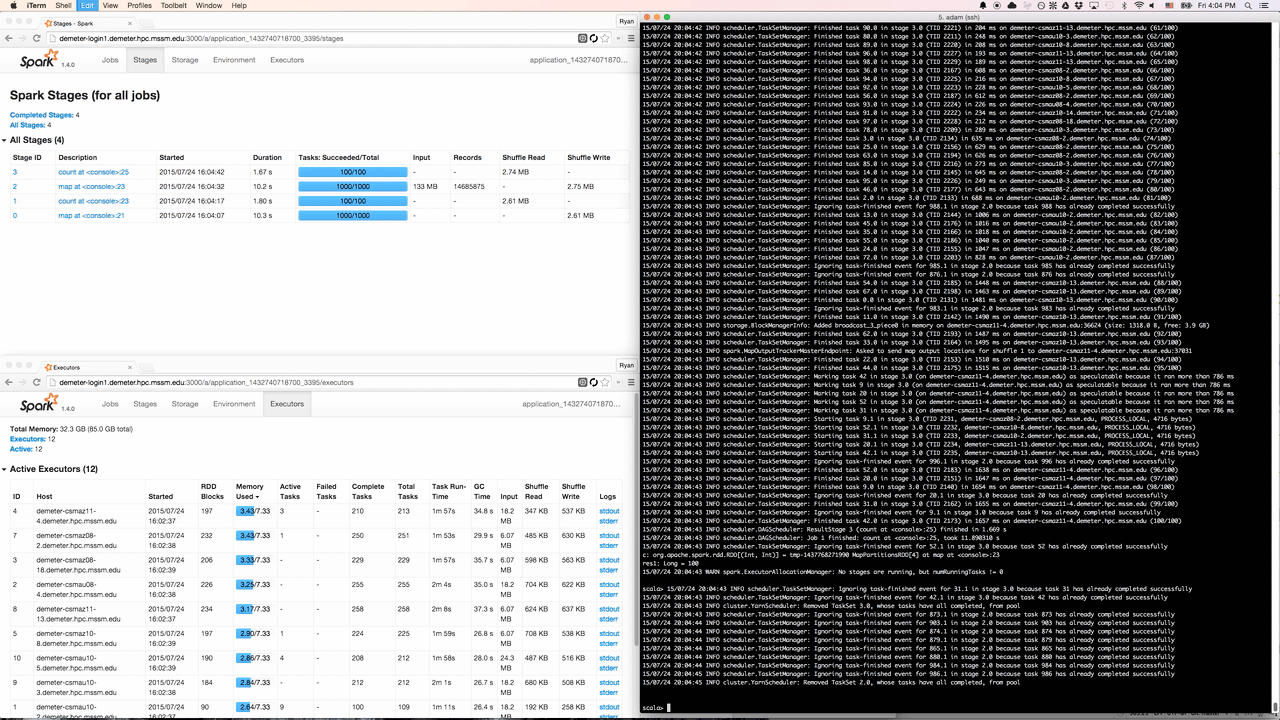
This led us to develop Spree, a live-updating web UI for Spark:
Screencast of Spree during a short Spark job
Spree looks almost identical to the existing Spark UI, but is in fact a complete rewrite that displays the state of Spark applications in real-time.
Spree displaying stages, executors, and the driver’s stdout in a terminal window
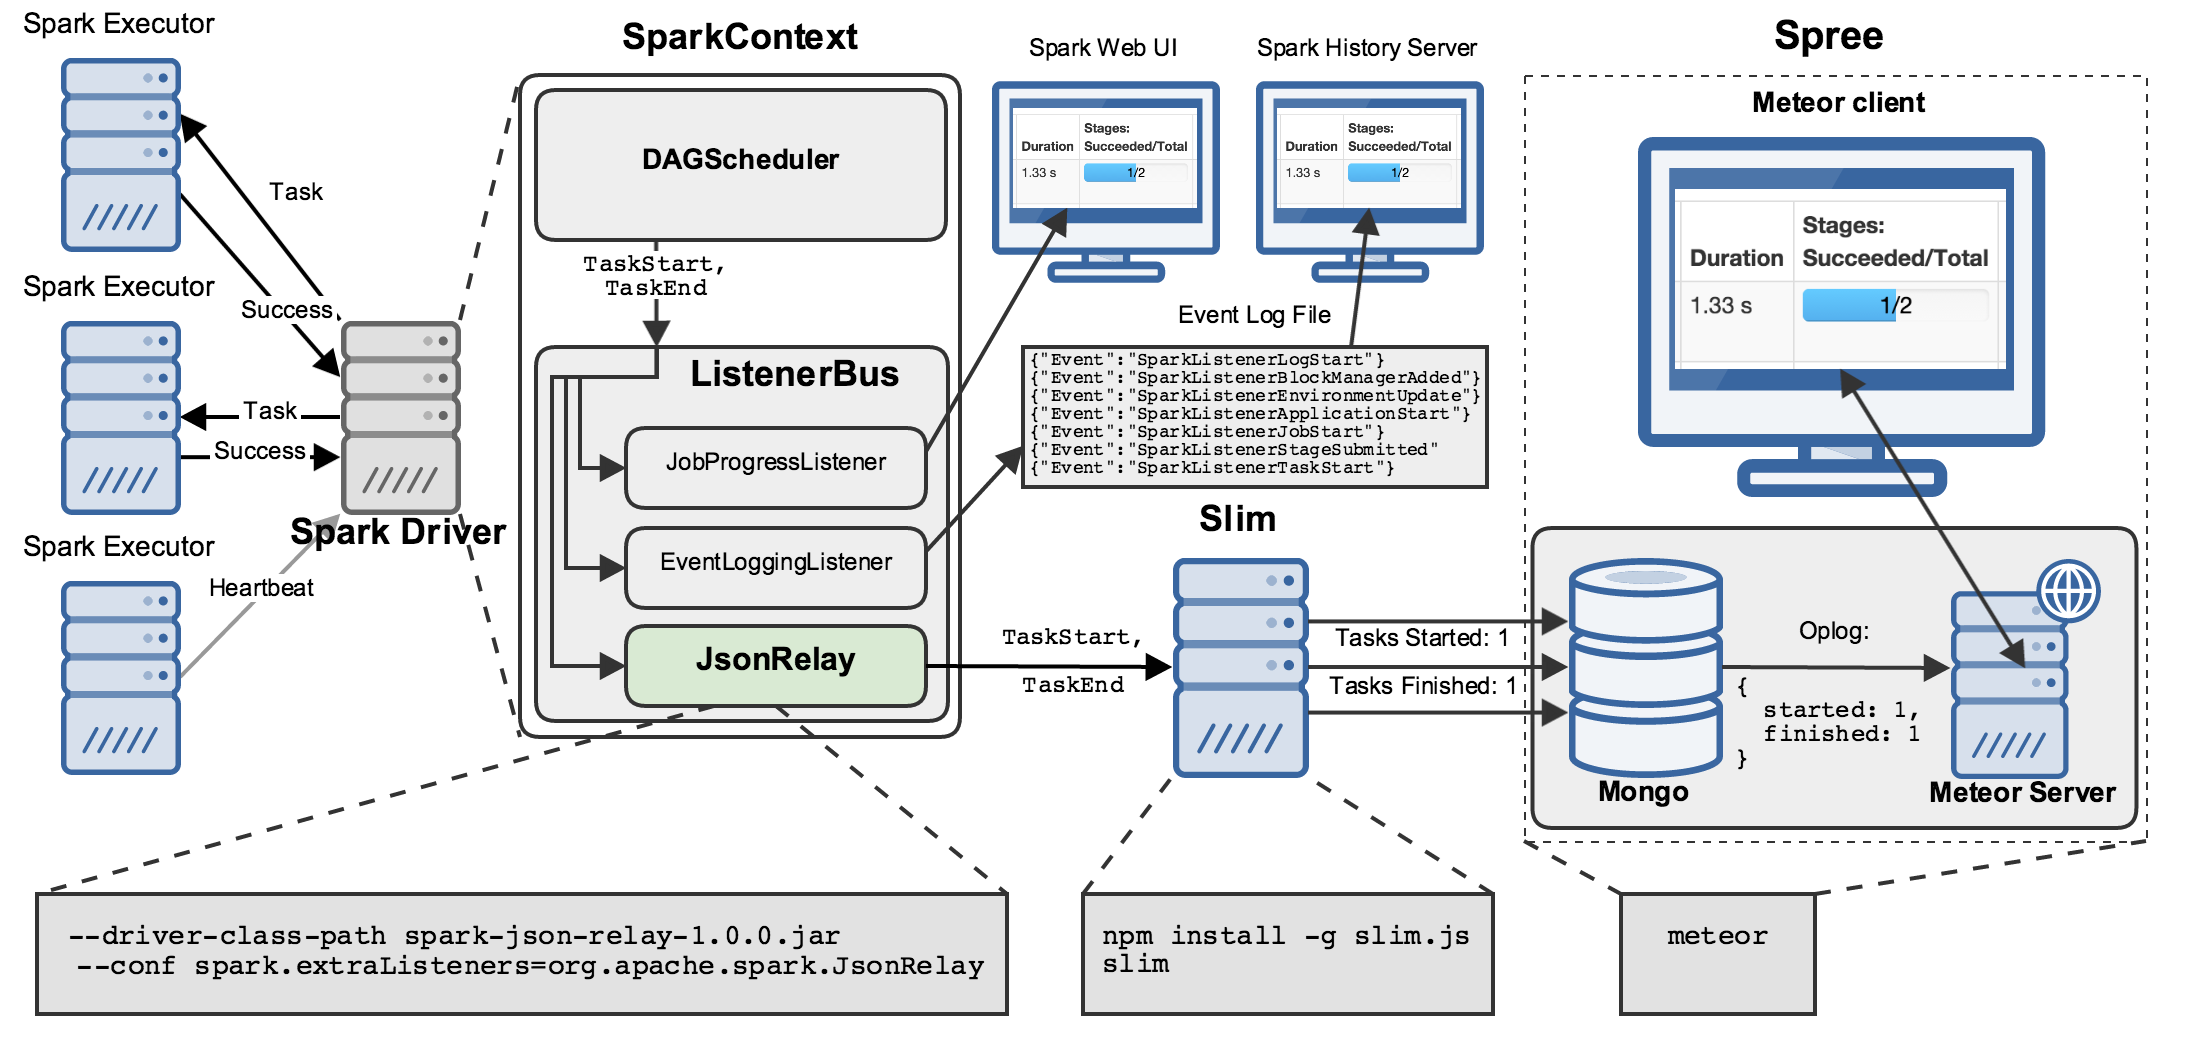
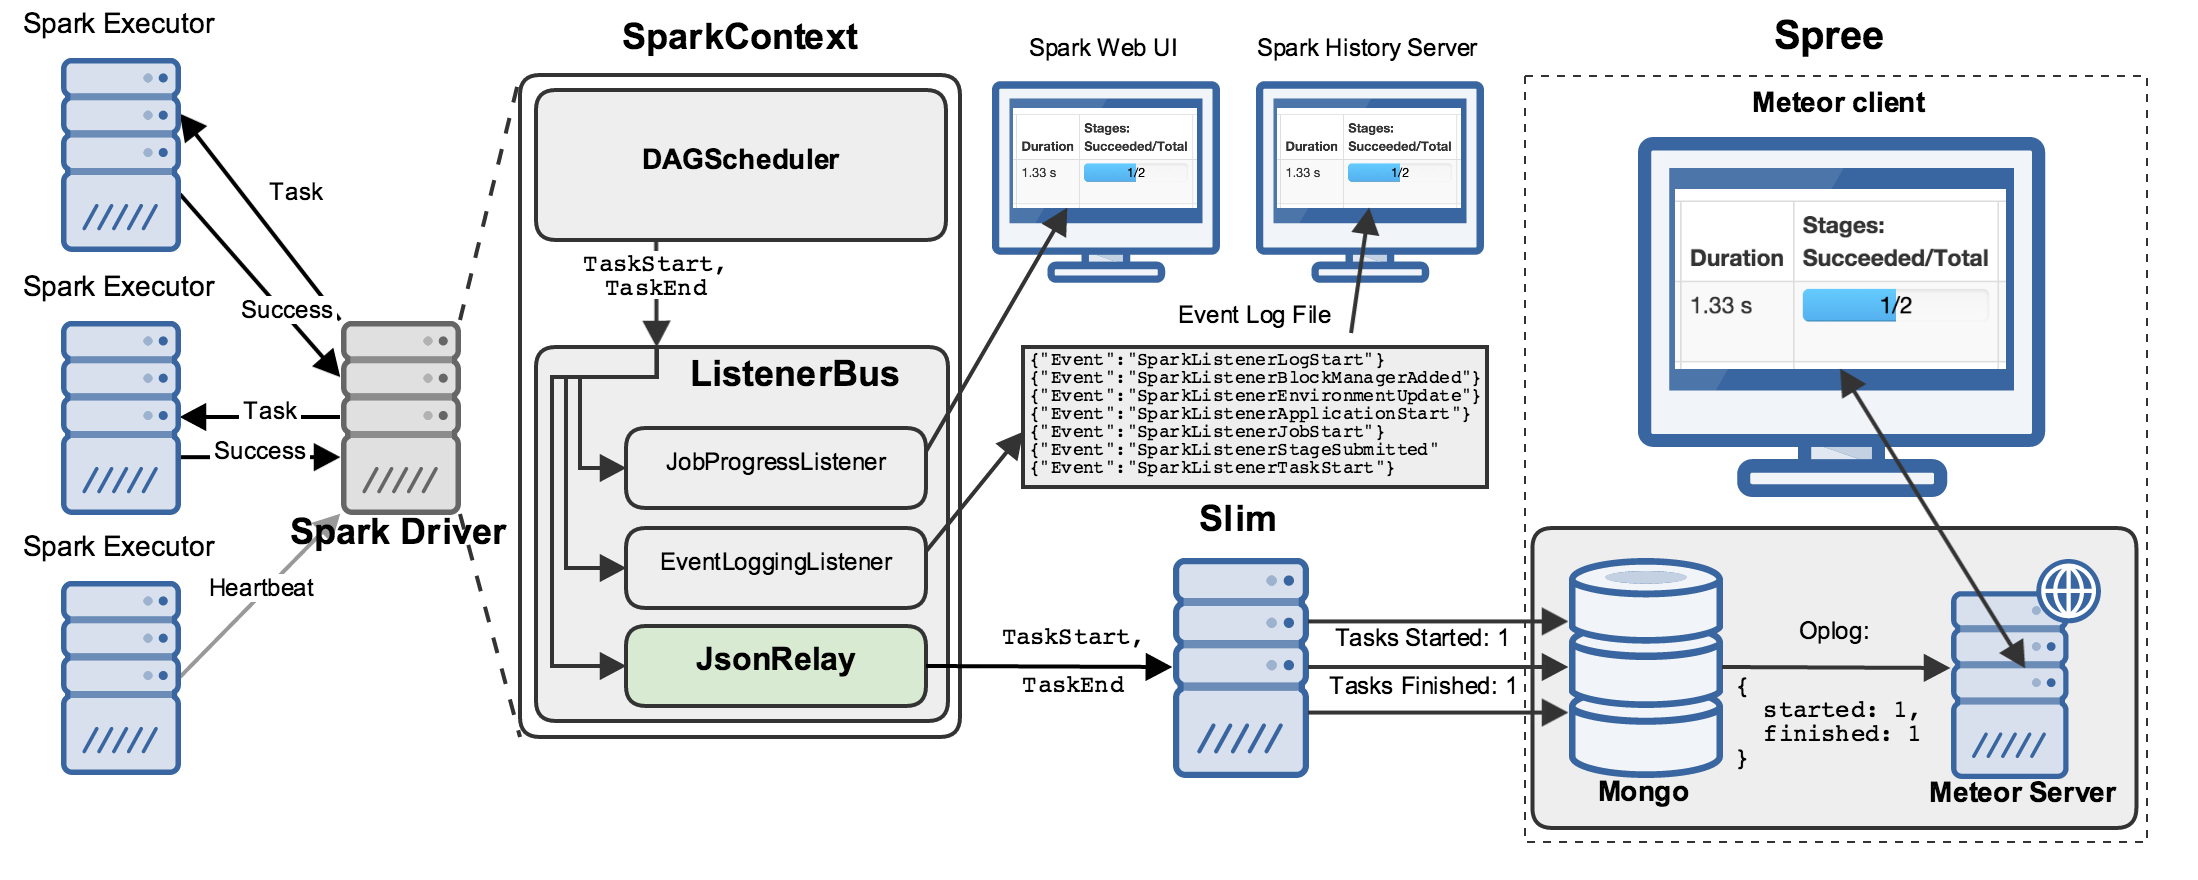
Several components are involved in getting data about all the internal workings of a Spark application to your browser:
There’s a lot going on here, so let’s walk through this diagram step by step.
Basic Spark Components
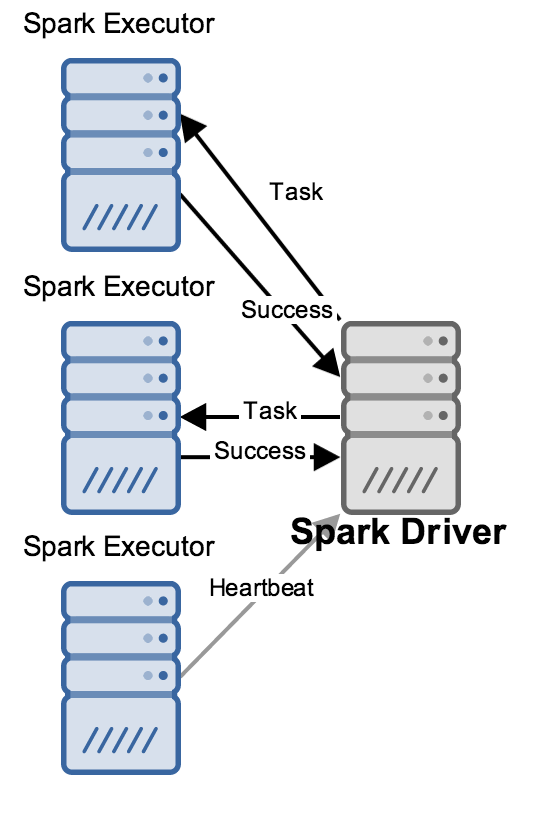
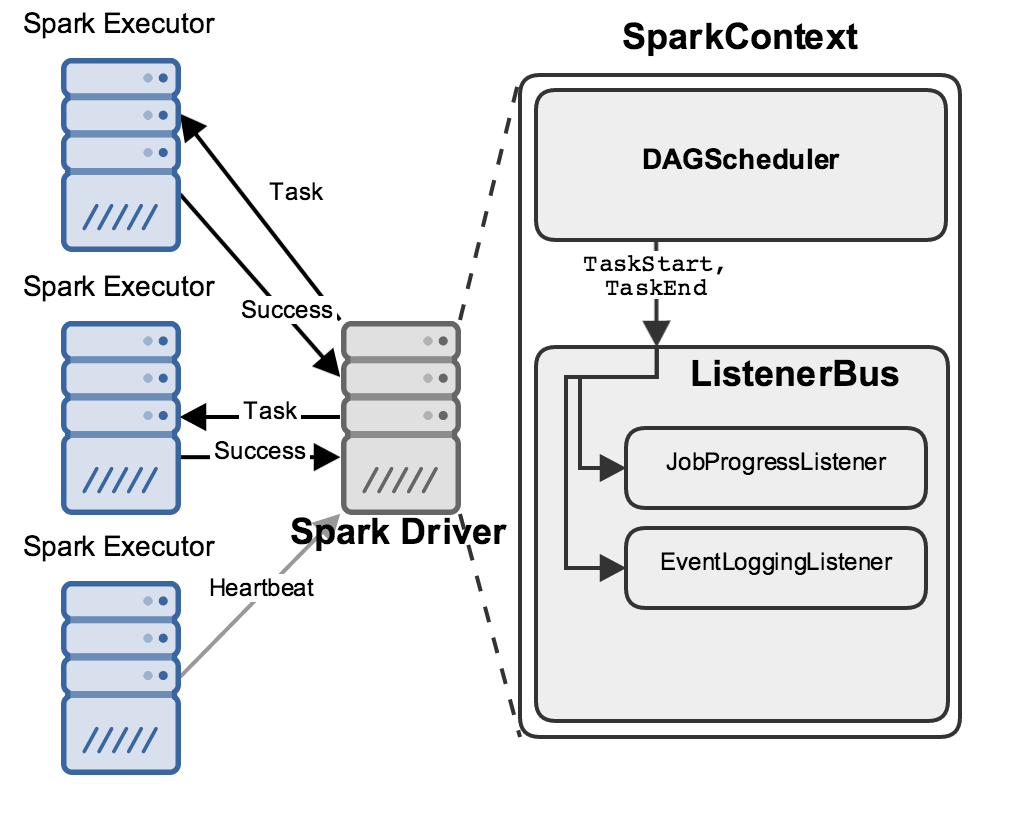
At a high level, a running Spark application has one driver process talking to many executor processes, sending them work to do and collecting the results of that work:
While this is happening, the driver is performing many bookkeeping tasks to maintain an accurate picture about the state of the world, decide what work should be done next where, etc. Two of its components in particular are relevant to this discussion: the DAGScheduler and the ListenerBus:
When anything interesting happens, like a Task starting or ending, the DAGScheduler sends an event describing it to the ListenerBus, which passes it to several “Listeners”.
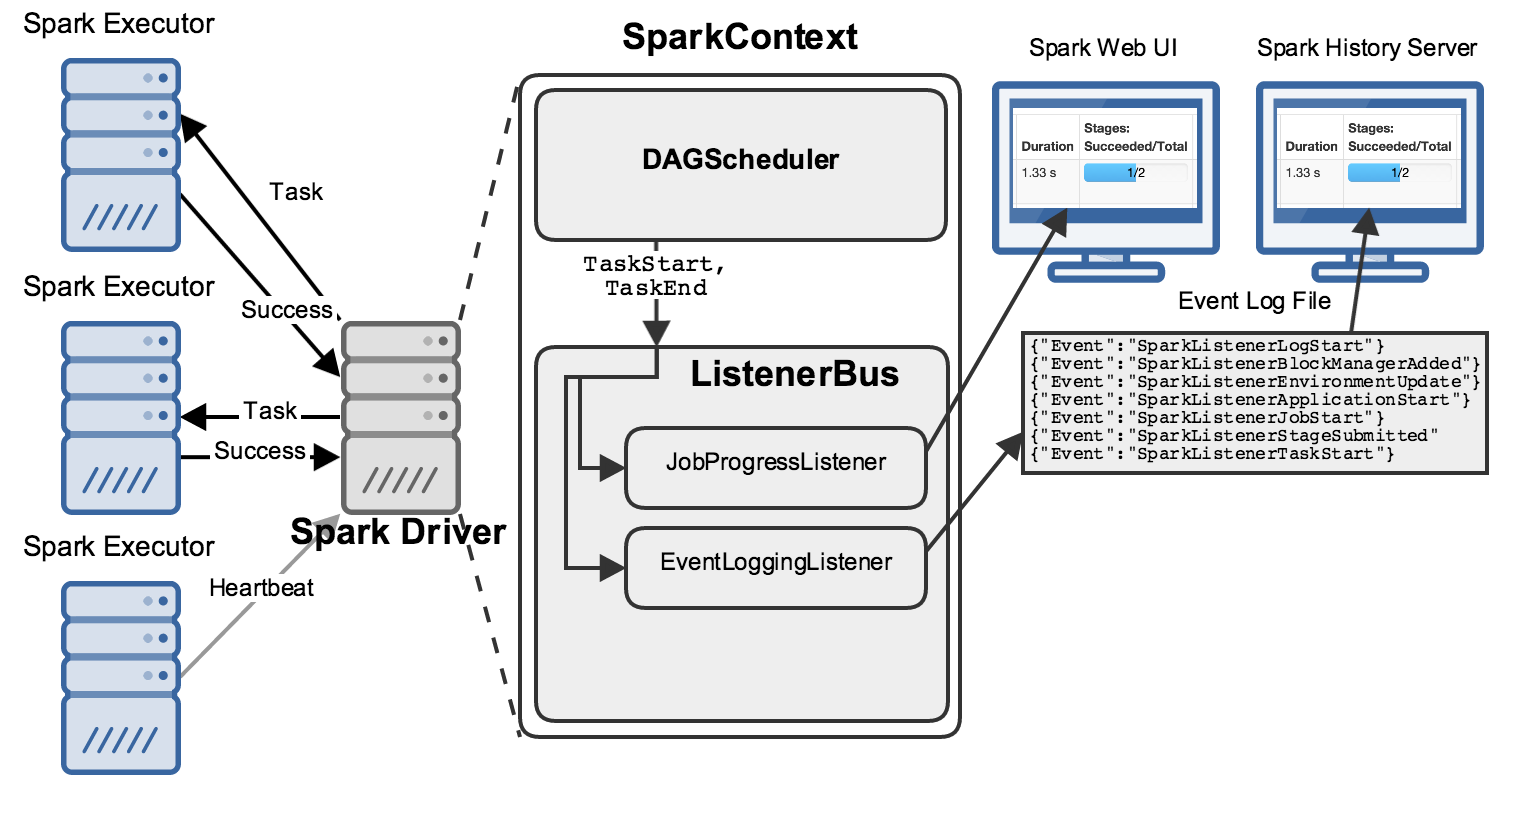
Here I’ve shown two important listeners: the JobProgressListener and the EventLoggingListener; the former maintains statistics about jobs’ progress (how many stages have started? how many tasks have finished?), while the latter writes all events to a file as JSON:
These listeners each power a web UI that you can use to learn about your Spark applications’ progress:
Present: a “live” web UI exists only while a Spark application is running, and is fed by the stats accumulated by the JobProgressListener.
Past: the Spark “history server” can be run as a separate process that ingests all of the textual JSON written by the EventLoggingListener and shows you information about Spark applications you’ve run in the past.
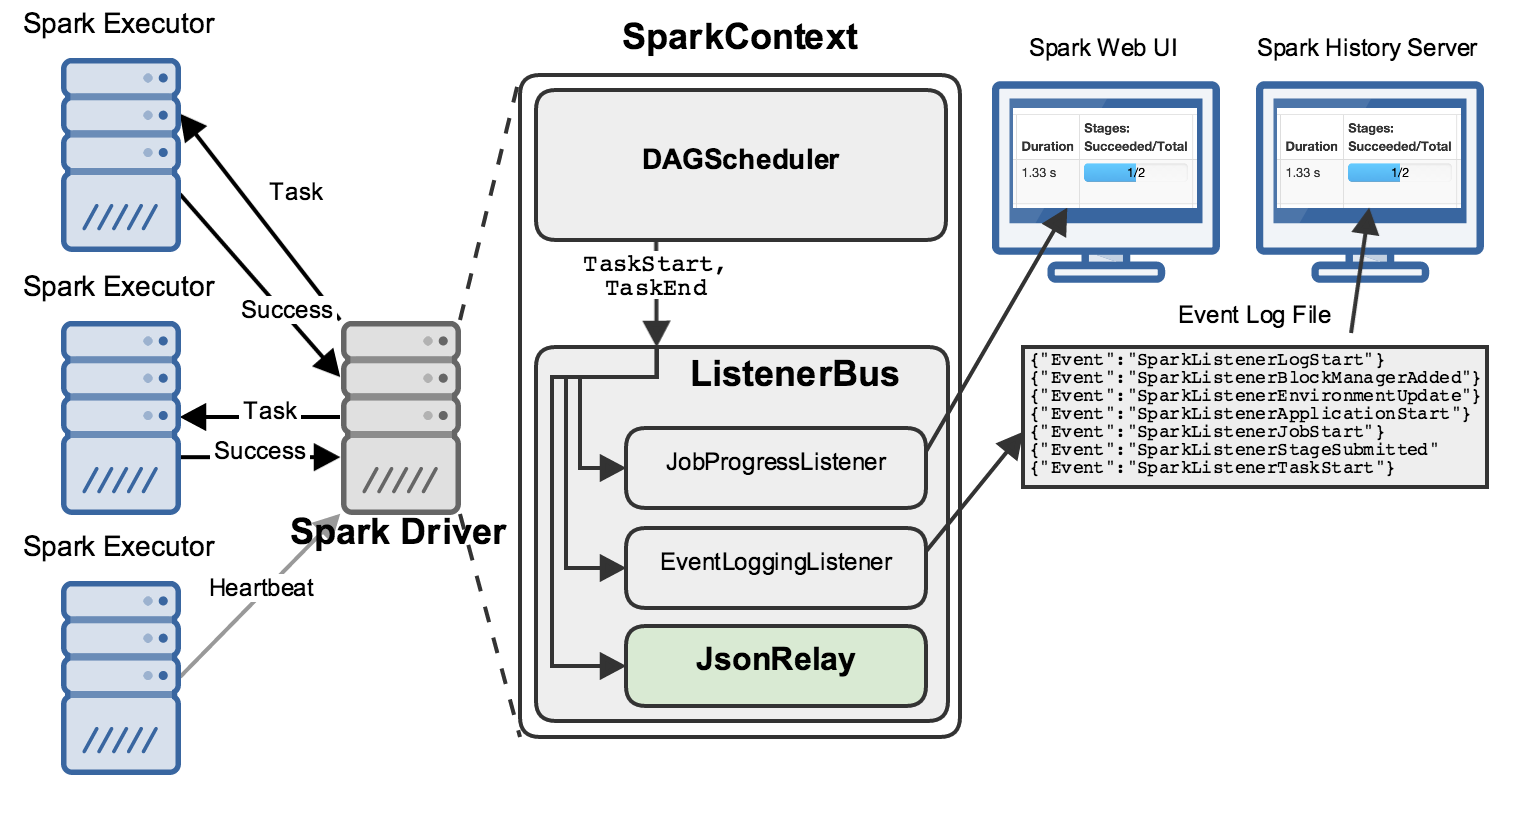
This works pretty well, but leaves a few things to be desired:
Running separate processes to view “present” vs. “past” applications can be a bit clumsy.
Using large text files full of JSON events as archival storage / an ad-hoc database creates problems, including causing the history server to be slow to start.
Listeners that ship with Spark and run in the driver are one-size-fits-all: customizing them to individuals’ needs is not really feasible.
Additionally, everything that runs in the driver must keep a very low profile so as not to bog things down.
So, our first step in innovating on Spark’s data-export, -storage, and -display landscape was to get the data out!
JsonRelay
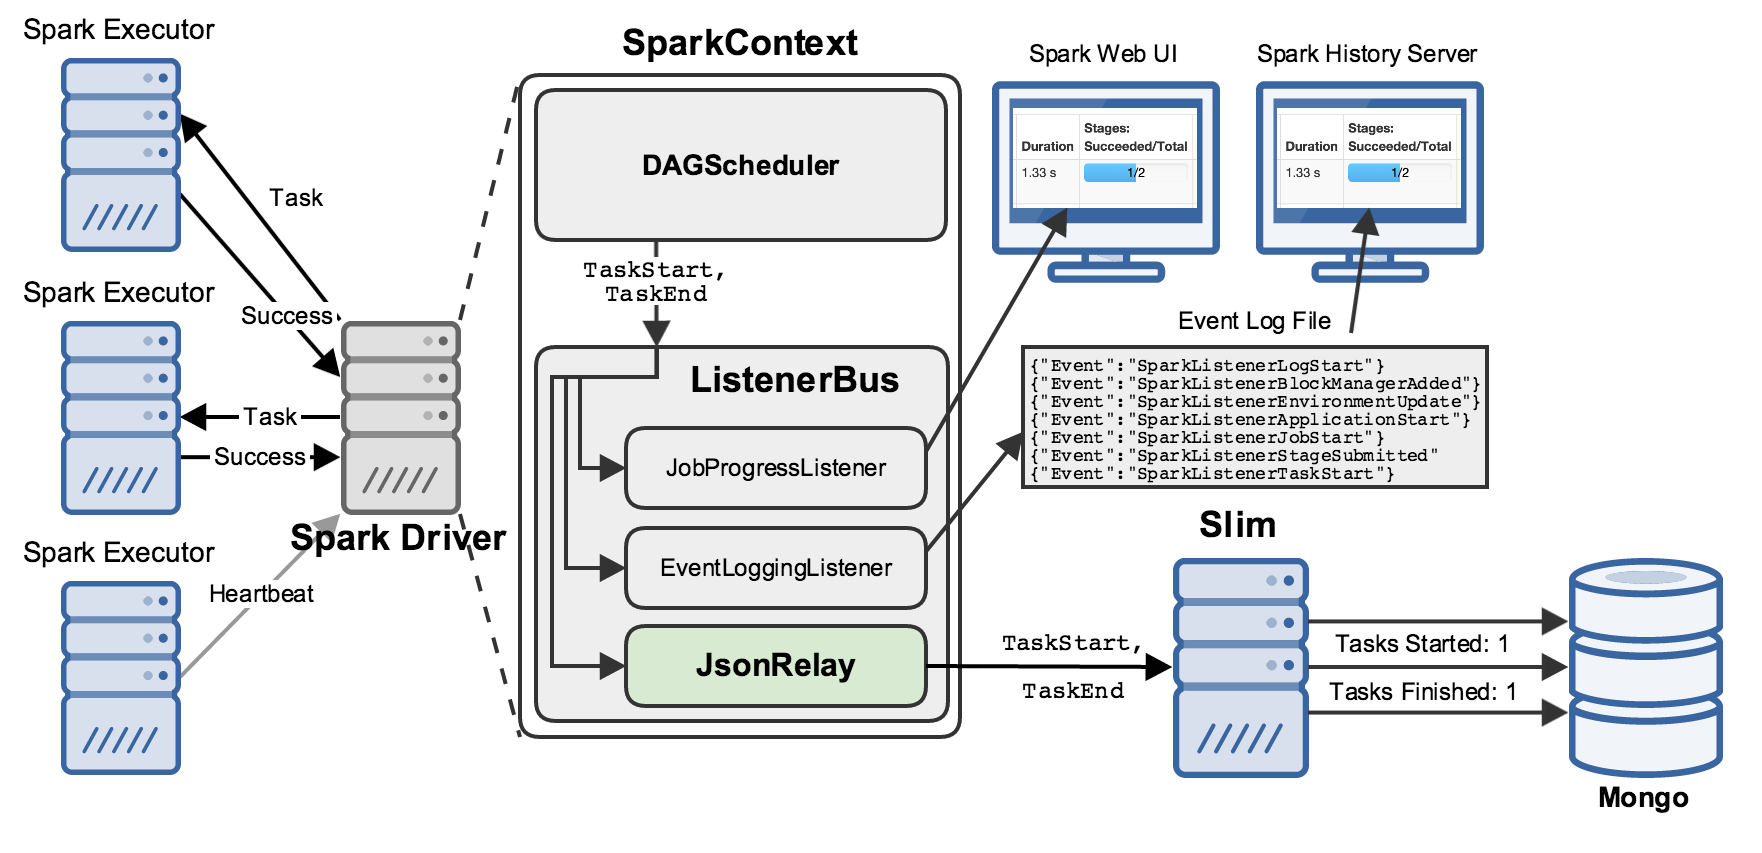
We do this by registering our own listener, called JsonRelay:
In our case, that address belongs to “slim”, a Node server that collects SparkListenerEvents and writes them to a Mongo database:
slim combines some of the best attributes of the JobProgress and EventLogging listeners:
It maintains state about all the relevant objects in a running Spark application (jobs, stages, tasks, RDDs, etc.).
It persists that state to Mongo, realizing the myriad benefits of using a proper database for archival storage, e.g. easy querying and retrieval by downstream processes.
JsonRelay and slim taken together represent a powerful tool for storing and retrieving information about Spark applications, and we hope that others will find it useful for a variety of purposes.
For us, however, the impetus for building them was…
Spree
Spree is the final piece of this puzzle: a web application that displays, in real-time, the data stored in Mongo by slim:
Getting data from Mongo through a server process to your web browser sounds complicated, but it is handled pretty magically by Meteor, a reactive web framework that powers Spree. Meteor provides powerful abstractions for adding this sort of “transparent reactivity” to applications of all shapes and sizes.
One particularly fortuitous recent development was Meteor’s release of a shiny new library for supporting React as a frontend to Meteor’s reactive-glue and back-end abstractions.
At the time of that announcement, Spree was facing issues re-rendering its pages’ DOMs in an efficient manner as deluges of events flooded in; pulling 100s of events per second off a web-socket is no sweat, but re-rendering large DOMs in response to each one was proving impossible.
Luckily for us, the React+Meteor integration deftly leverages React’s clever minimal-DOM-updating logic and Meteor’s declarative+reactive-UI functionality to make for an application-development experience that is unprecedentedly powerful.
Path Forward
Spree’s real-time display of our Spark jobs has been a boon to us, making the task of running multiple and long-running Spark jobs more painless, saving our ⌘R-fingers and freeing us from the tyranny of infinite auto-refresh!
Combined with the ability to dump our Spark events into a database, keep past and present data in one (easily query-able) place, and quickly iterate on what we collect, store, and display, Spree (and friends) represent significant improvements to our experience using Spark that we hope others can benefit from.
The documentation for Spree and slim both go into a lot more detail about installing and using these tools, the relationships between them, and functionality added by or missing from Spree relative to the existing Spark UI; please give them a try and let us know in the issues there if you run into any problems!
As a parting gift, here is Spree running in Chrome on a Nexus 6, for when you just have to monitor your Spark jobs on the go 😀:
