
Graph visualizations of MHC alleles
01 Nov 2016 | by Leo RozenbergThe MHC gene family is well known for its polymorphism. The IPD-IMGT/HLA database provides the official reference sequences for the alleles found in this region. In addition, the Anthony Nolan HLA informatics group provides a reference alignment of these alleles.
Here is a pared clip (we insert ellipses to skip lines) of the output for the genetic DNA of HLA-A:
This format textually encodes differences between the reference sequence (the
first one, A*01:01:01:01) and the other, alternate, allele sequences, along
the file columns.
Using special characters, the reader can tell if the alternate nucleotide
is unknown (‘*’), the same (‘-‘), different (‘A’, ‘C’ …etc), or a gap (‘.’)
to the known reference nucleotide in the same column.
While this format has its place, it isn’t useful for quickly visualizing the diversity of this region. We’ve created a small utility to marginally improve visualizing these alignments.
mhc2gpdf
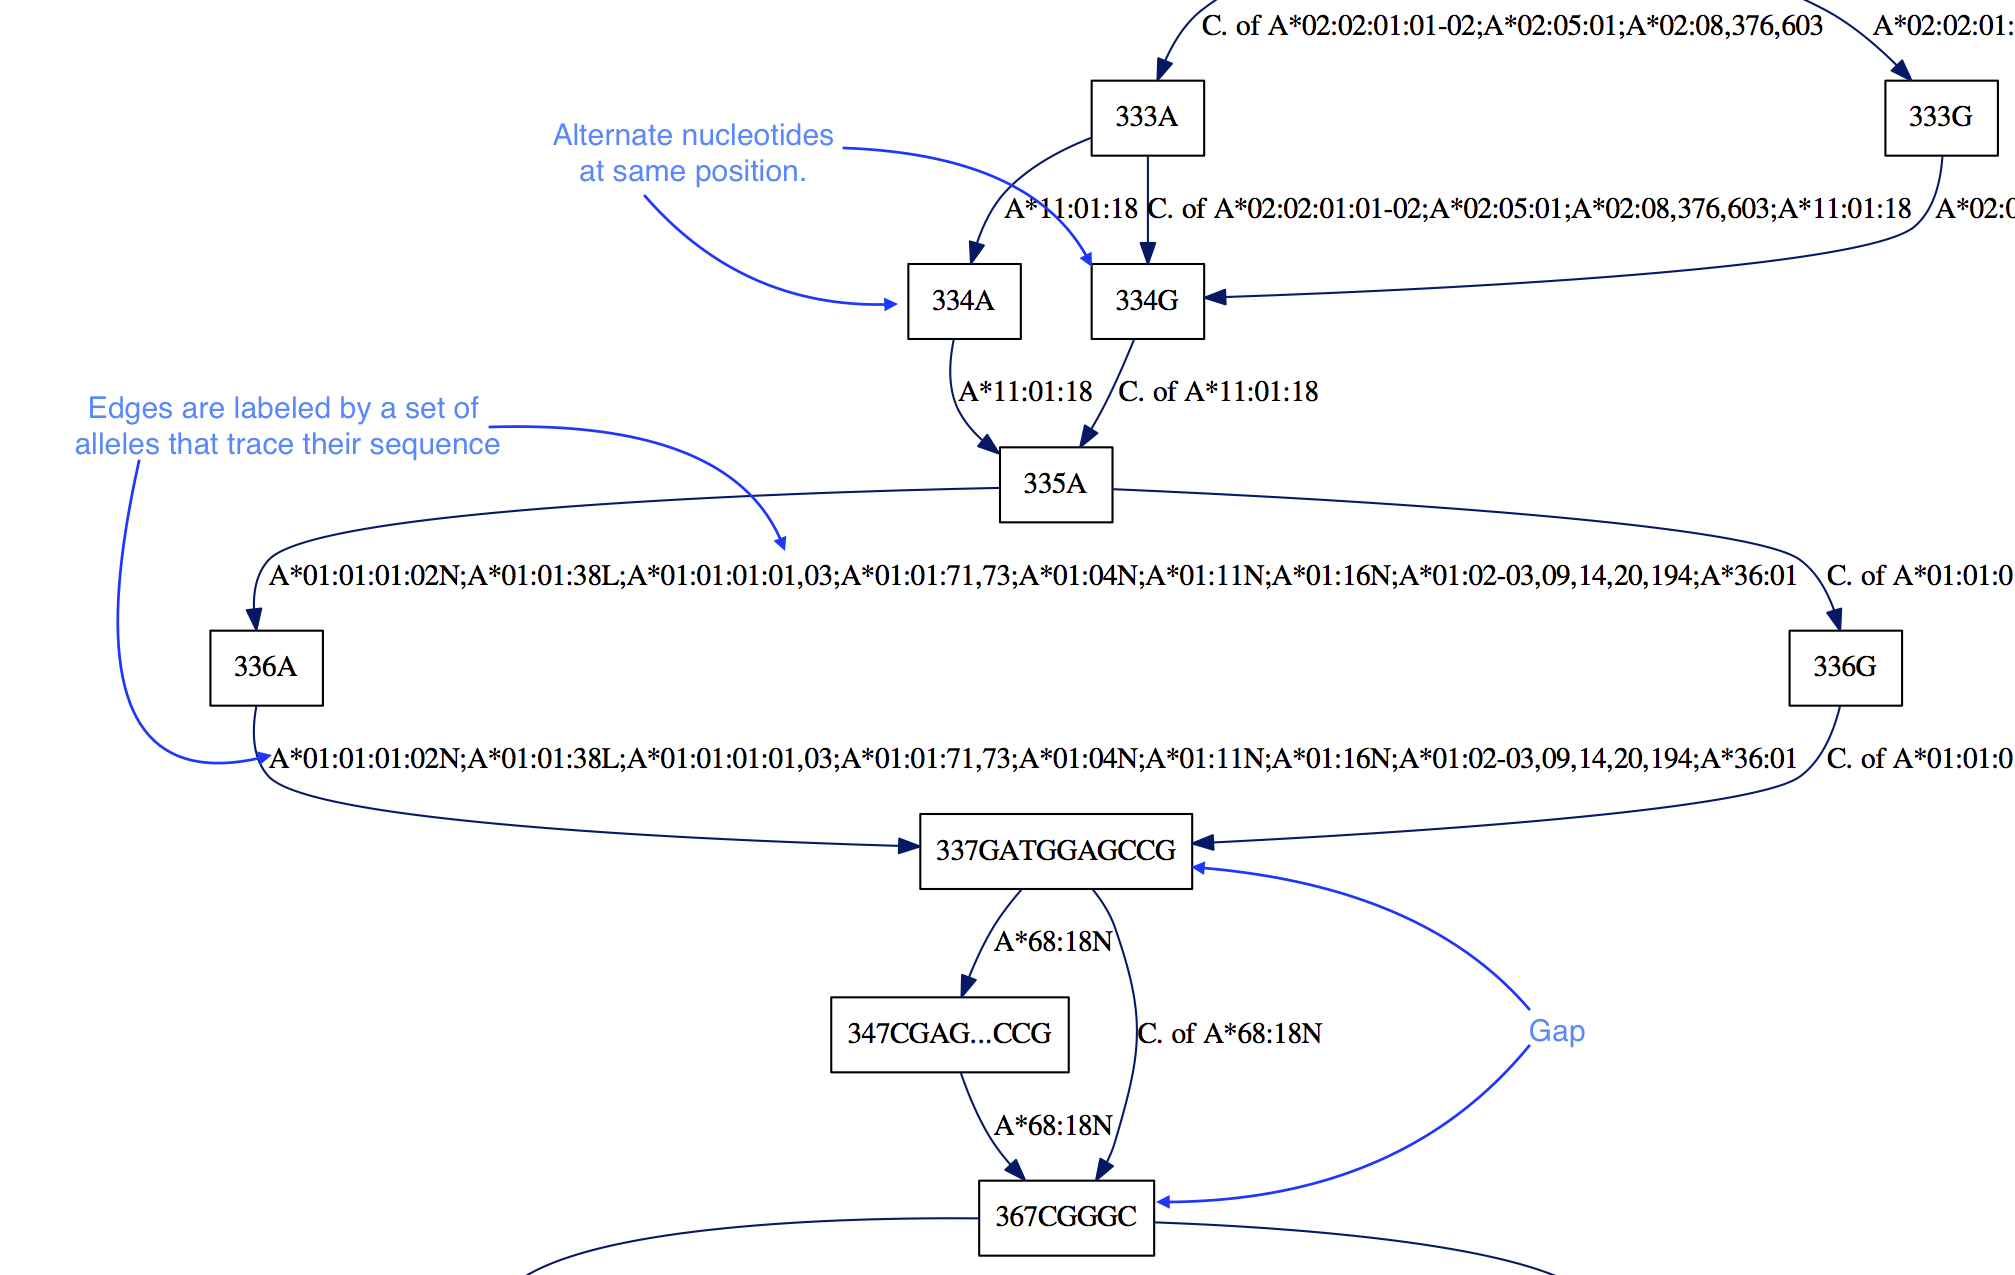
Our first intuition for this task was to compress the redundant sequence information. Grouping shared sequence segments as nodes led to us thinking about the entire alignment as a graph, and from this starting premise some properties followed naturally:
- Alleles are represented by edges, such that one can trace the sequence of the allele by following edges.
- Alignment information is preserved by adding a numerical label of alignment position. Different nucleotides at the same position are represented by different nodes: “336A” vs “336G”.
- Gaps are encoded by the edges that point to nodes with a position
farther than the position at the “end” of a node (the start label plus the
length of the node sequence). In the example above, the “337GATGGAGCCG”
node ends its position at 347 since
len(GATGGAGCCG) = 10. Therefore there is a 20 nucleotide gap, in all of the alleles except “A*68:18N”, as indicated by the edge to “367CGGGC”.
Underneath the hood, mhc2gpdf first parses the alignment file;
then constructs the desired graph representation by creating
the desired nodes and edges;
finally, it writes a dot file and calls Graphviz to
render the dot file to PDF.
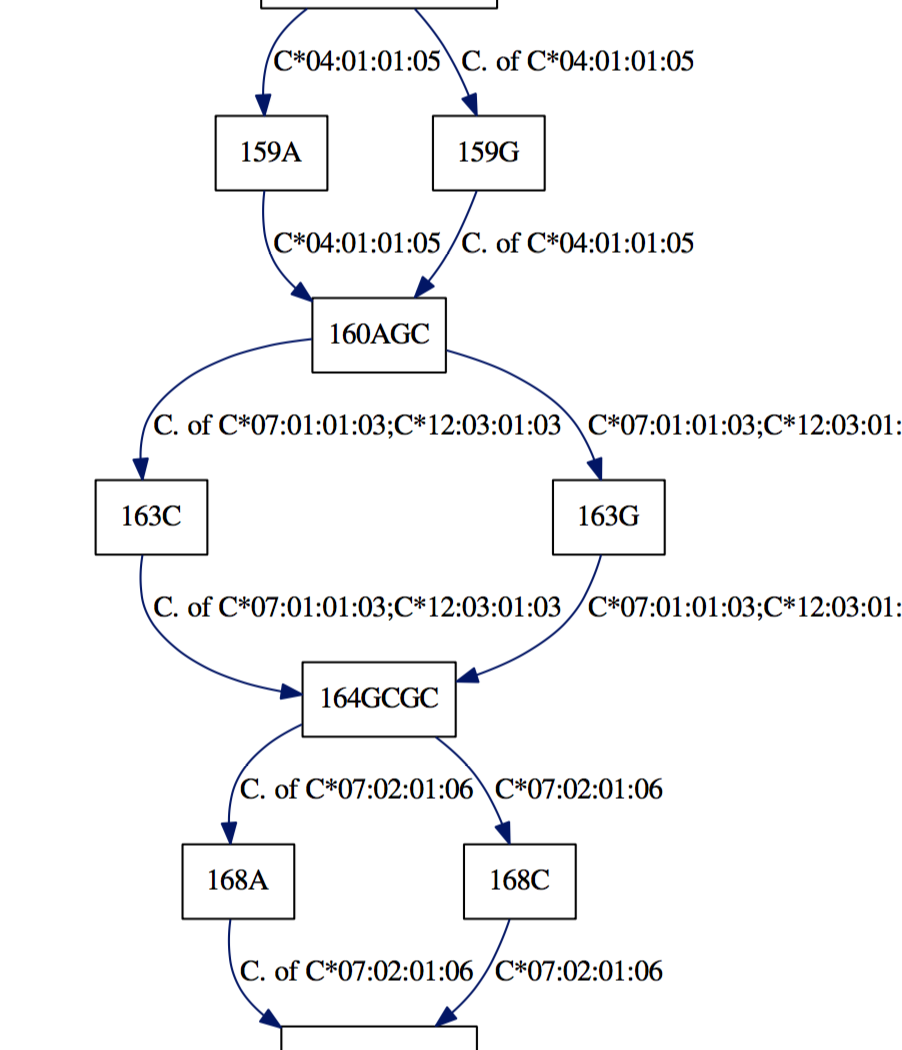
Samples
With these pdfs we can quickly determine allelic differences:
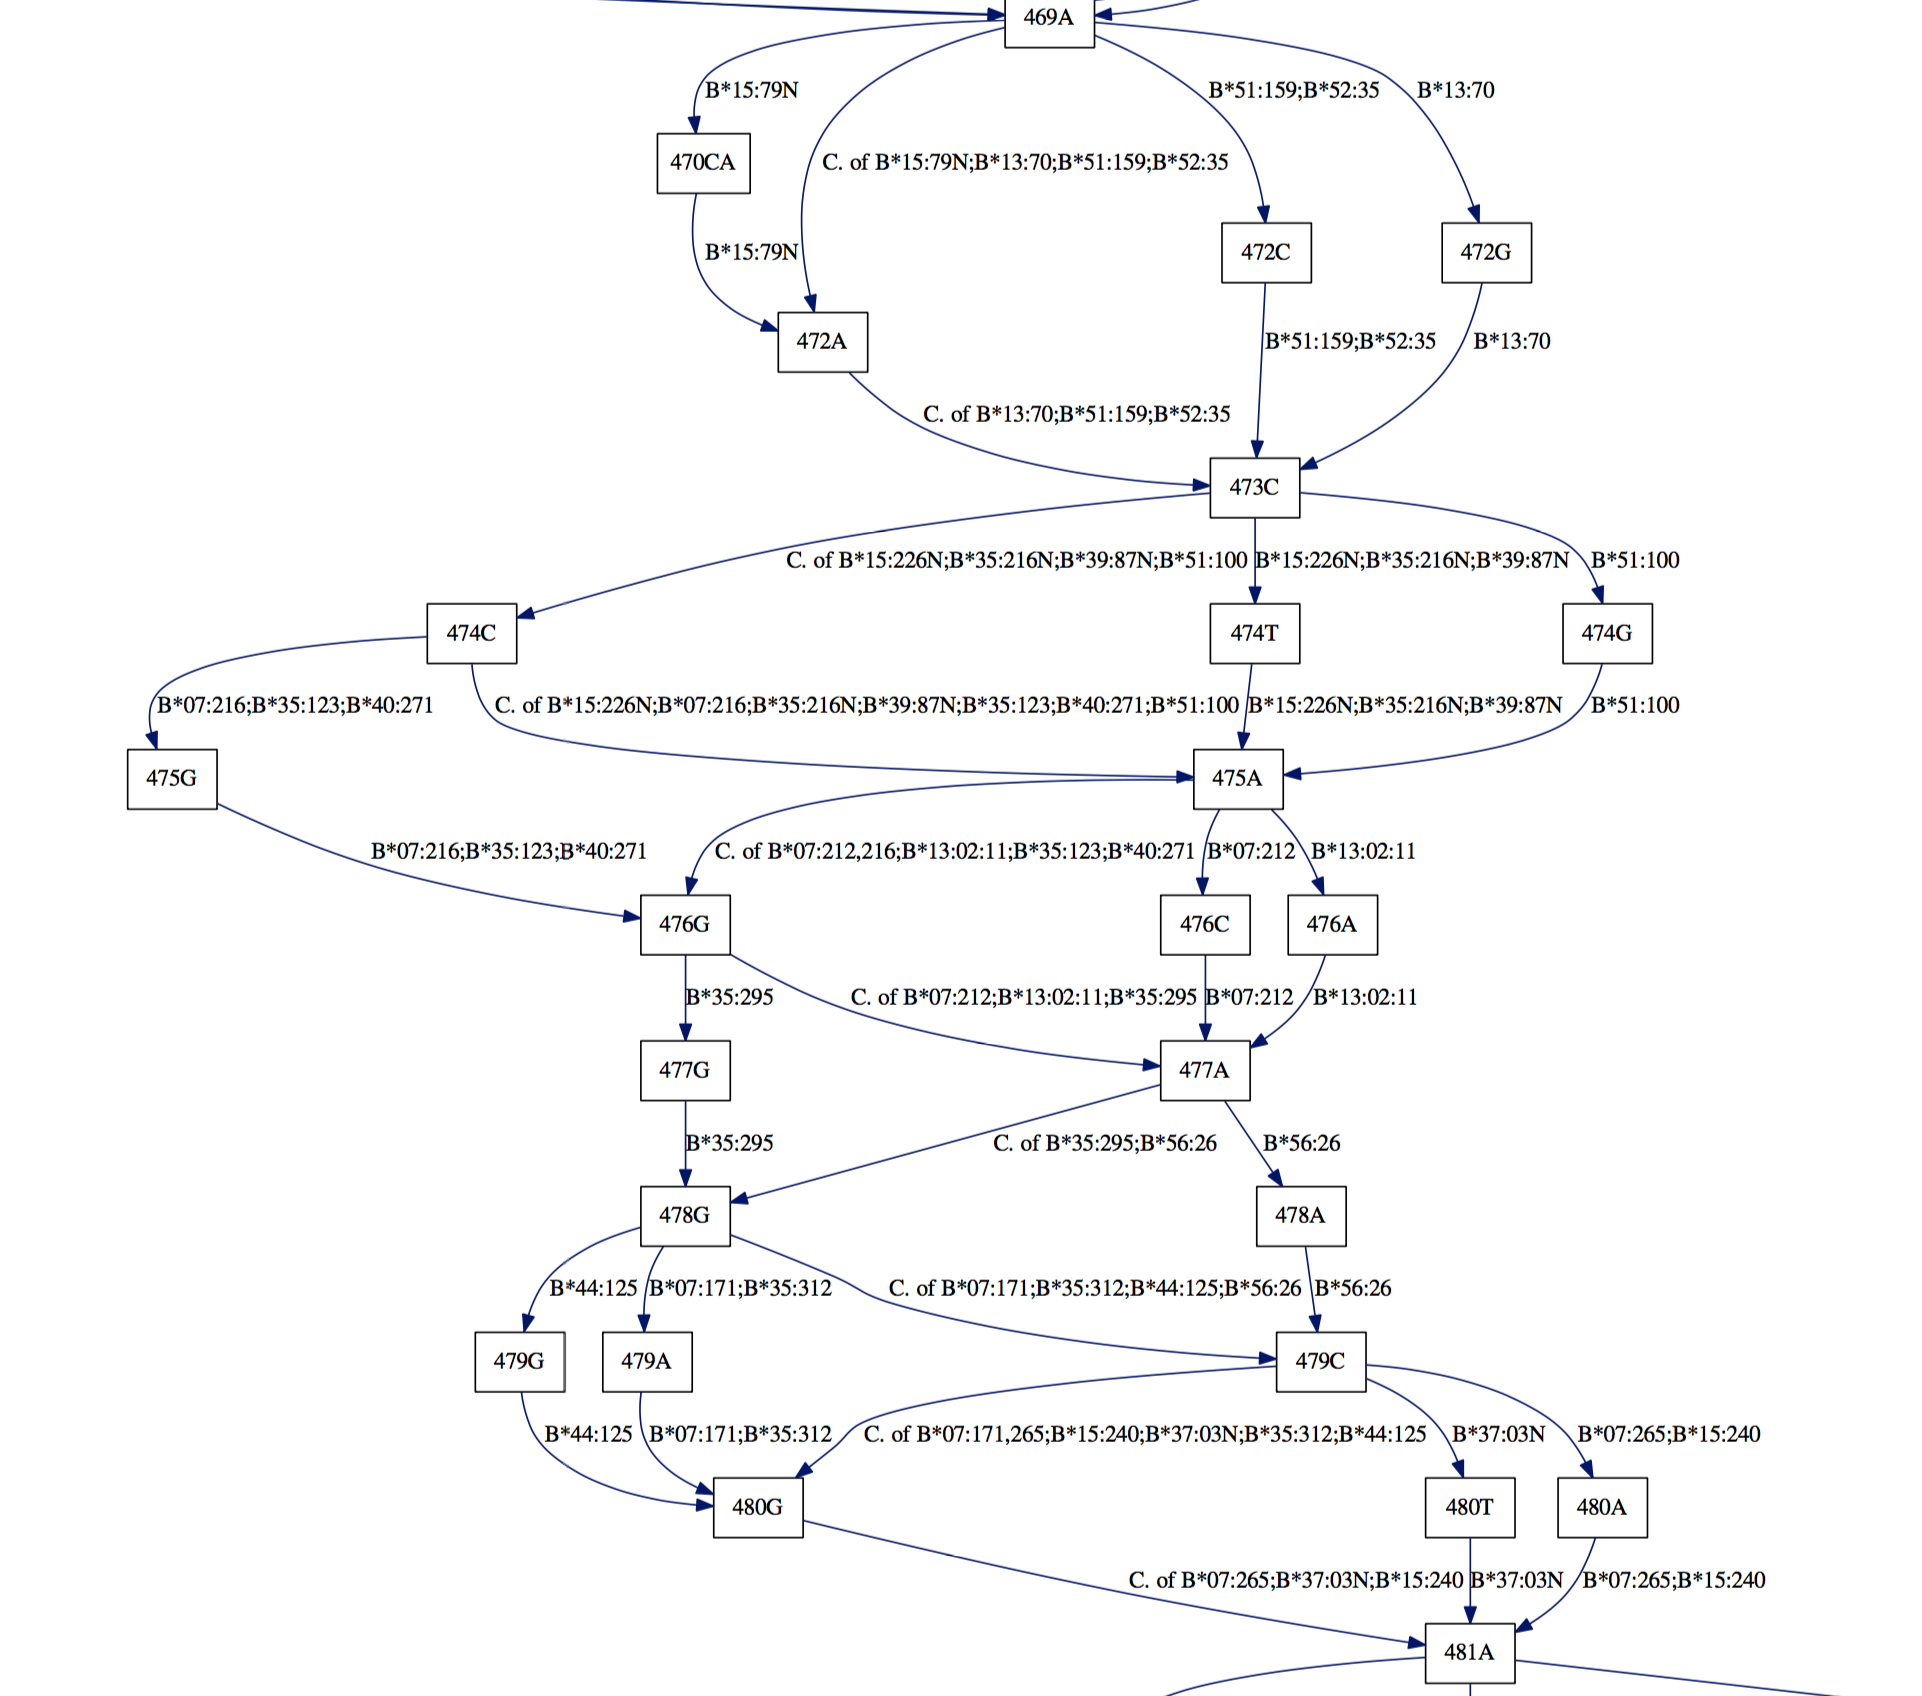
Appreciate the dense polymorphism of these genes:
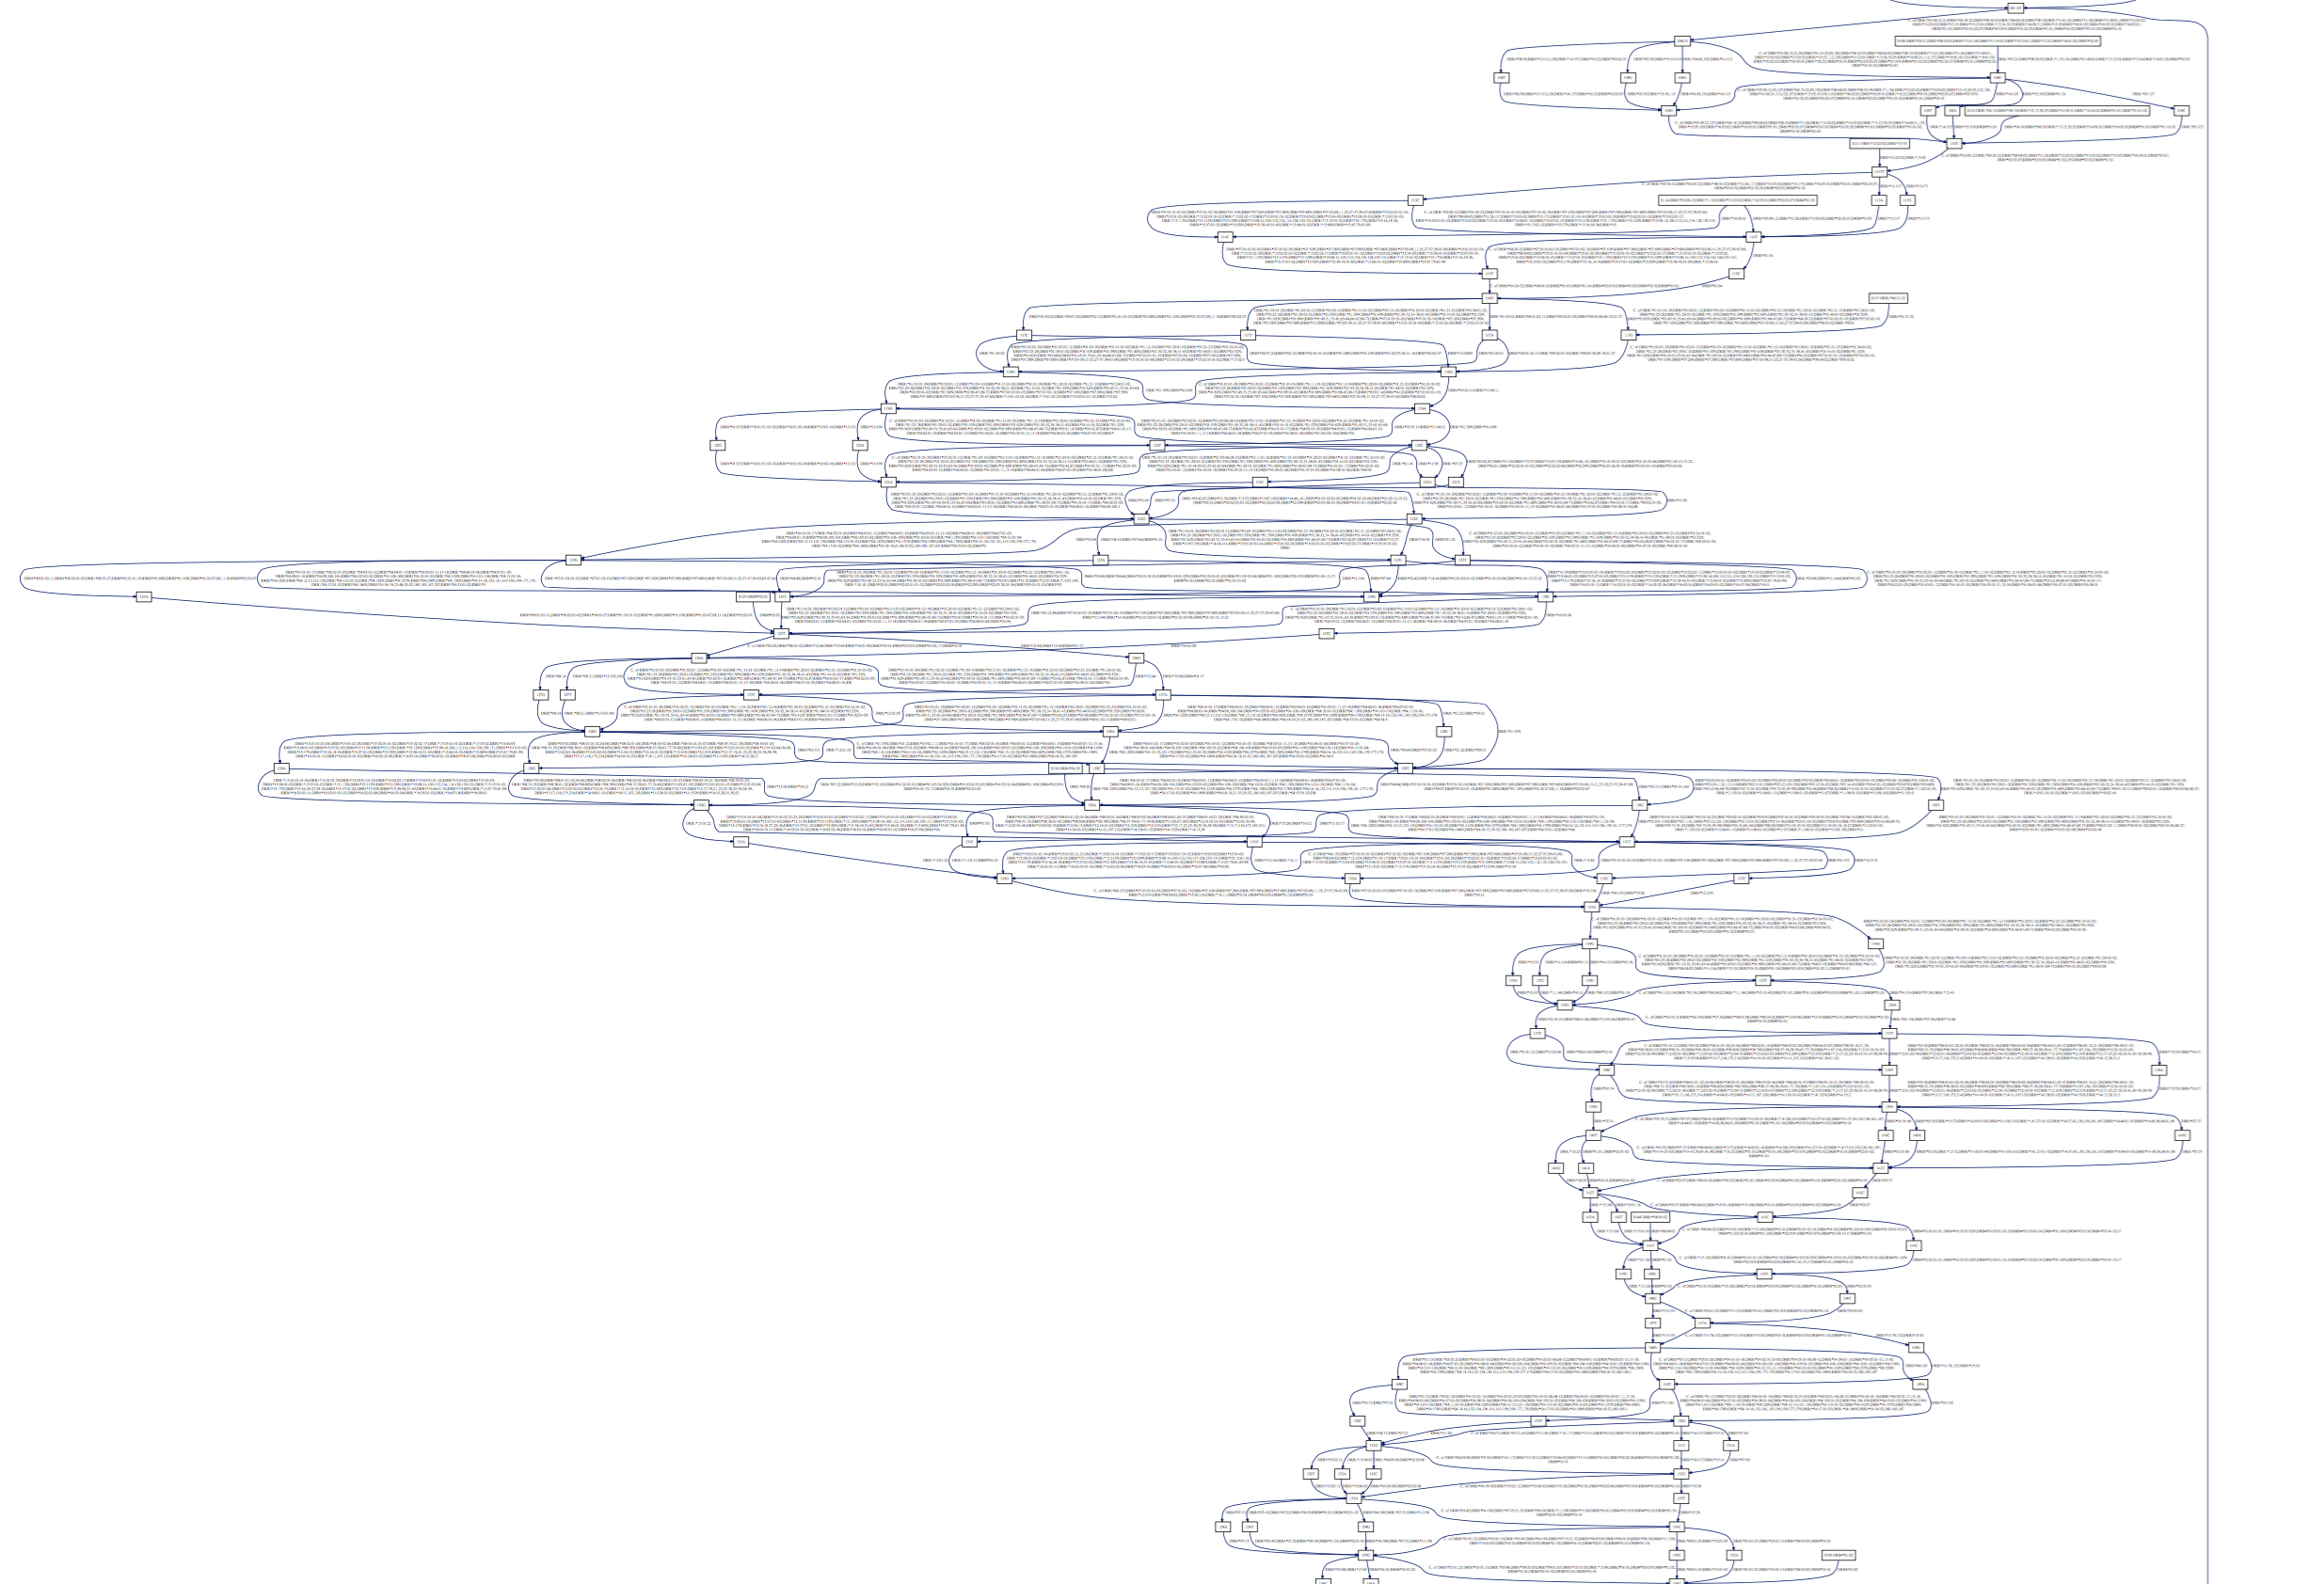
And see long gaps in the Class II DRB nucleic sequences:
We’ve used our tool on the latest IMGT release (2016-10-19) and provide the dot and rendered pdfs: happy browsing!
Reading the graph
We’ve made some stylistic choices to make the graph easier to understand:
- We run-length encode the leaf nodes of the tree that represents the allele edges: instead of “A*01:01:02,A*01:01:04,A*01:01:05…A*01:01:37”, we’ll write “A*01:01:02,04-37”.
- If an edge represents more than half of the allele set, we’ll describe its complement and prefix the string with a “C. of”, short for “Complement of”.
- We add “Start” nodes, prefixed with an “S” to indicate where the alignment has sequence data for each allele. These are similarly encoded as the edges.
- We add “End” nodes for the same reason. These just have the final position.
- We add “Boundary” nodes, which are represented by “|” in the alignment file for exome boundaries.
Feedback
We hope that the genetics community finds this tool useful and we look forward to your feedback on GitHub.