We previously announced pileup.js,
a genome viewer designed to be embedded in web applications.
Since then, we have restructured the code base and created a cleaner distribution.
These both make pileup.js easier to integrate into applications.
We faced several challenges along the way
that are likely to be encountered by anyone building and releasing modern web libraries,
so this post will detail the workflow we’ve come up with to solve them.
Bundled File Distribution
Adding pileup.js to your application is as simple as including our bundled distribution file,
which can be downloaded from NPM, Github, or Browserify’s CDN.
That file defines a global function require, which you can use to create new pileup instances:
// Request the pileup objectvarpileup=require("pileup");// and create an instancevarp=pileup.create(yourDiv,{...});
This setup is great because you need only include a single JavaScript file;
in particular, you don’t have to worry about managing/including its dependencies.
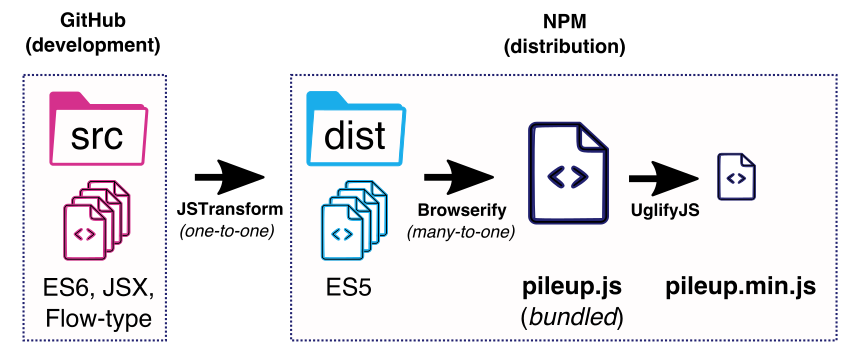
To make this possible, our code goes through two transformations: jstransform and browserify:
(Our current workflow for developing and distributing the pileup.js code (1,2))
JSTransform: transpiling ES6 into plain JavaScript
The pileup.js code is written in
EcmaScript 6 (ES6) and JSX,
and annotated with Flow types.
These syntaxes are great and tend to take a lot of burden off the developers,
but they also come with a necessary code transformation step,
commonly referred to as transpiling.
What this means in practice is that people can’t use the original code directly,
since we still live in an EcmaScript 5-dominated world.
For example, if you were to check out our code from GitHub,
and try to use it “as is”, this is what you will get:
$ echo"require('./src/main/pileup.js');" | node
./pileup.js/src/main/pileup.js:21
import type{Track, VisualizedTrack} from './types';
^^^^^^
SyntaxError: Unexpected reserved word
...
This SyntaxError is expected,
as import type syntax is part of Flow and not ES5.
To make our code ES5-compatible,
we have to run it through JSTransform first:
This transpiles all the code from the src folder into another one.
Once the transpiling is completed,
you can now start using the transformed code under dist/:
$ echo"require('./dist/main/pileup');" | node
# No errors
As such, it does not make sense to distribute the untransformed code via NPM,
nor does it make sense to keep track of the transformed code via GitHub;
therefore, we ignore the dist folder via our .gitignore
and list only the files under dist for release in our package.json:
..."files":["dist","style"],...
Browserify: bundling everything into a single file
Even if we distribute the plain ES5 code,
we still need to make things easy for people who would like to use pileup.js in their web applications.
And by default, it is not possible to use a library structured as a node module
as they don’t understand require statements
and can’t handle a module’s multi-file structure.
Browserify solves this by converting a node module into a form that can be used for web applications.
It can bundle a node library and all of its dependencies into a single file by wrapping it up in an anonymous closure
and optionally exporting a function (require) to access its contents.
When run on a project folder,
browserify takes hints from your package description (package.json)
and starts the process by reading the module specified in the browser property:
..."browser":"dist/main/pileup.js",...
It then traverses all the code that is used by this file and its dependencies.
These files get bundled in a closure
and structured in a way to make dependencies work seamlessly within that single bundled file.
This means that if you open the bundled pileup.js and examine its contents,
you will also see the code for our dependencies, such as react, d3 and underscore.
After transpiling our code and before publishing it on NPM,
we run browserify as a task and bundle the code up:
$ cd pileup.js/
# npm run browserify$ browserify -r .:pileup -v--debug-o dist/pileup.js
This
calls the command line browserify utility on the current folder (.);
allows access to the main browser module via pileup alias, so that you can require('pileup');
creates a map from the bundled file into individual source files for easier debugging;
saves the bundled file as dist/pileup.js.
And since this new browserified file is under dist/,
it also is distributed via NPM so that people don’t have to bother with all these steps
and can use this file directly from the repository:
$ npm install pileup --save$ ls node_modules/pileup/dist/*.js
node_modules/pileup/dist/pileup.js
node_modules/pileup/dist/pileup.min.js
UglifyJS: optional transformation to compress the code for production
Minification dramatically reduces the size of our bundled file.
Here is the proof:
$ du -sh dist/*.js
4.2M	dist/pileup.js
556K	dist/pileup.min.js
You can see that the bundled file, pileup.js, is gigantic by web standards
while the minified version, pileup.min.js, is much more reasonable.
To accomplish this,
we need to transform our code once more, this time through UglifyJS:
which turns the code into an ugly yet functionally-equivalent form
by renaming variables and reducing whitespace in the file.
This minified file is better for distribution,
but it is terrible for development purposes since it is almost impossible to debug or read.
Therefore, our tests and playground examples all make use of the bundled version instead of the minified one;
but we encourage the use of the minified version for production purposes.
Decoupling transformations
Although the current structure of pileup.js is now relatively simple,
we had to try different configurations with different setups before settling on this particular solution.
Before this, we were running browserify
and transforming the code at the same time using jstransform extensions.
Although the final output was the same,
we hit multiple issues during tests/flow-checks
and reducing the size of other web applications that make use of pileup.js.
Specifically, the former was due to the difference between the way watchify and flow were parsing the code, which are both required for our test procedures.
When transforming the code simultaneously with jstransform and browserify,
we were asking it to alias the main module as pileup to be able to require it.
However, when watchify was trying to bundle the main code together with the tests,
the relative path the tests files were using to require the main module was causing trouble,
therefore breaking many of our tests.
If we started using the pileup alias instead of the relative paths to require the module,
this time flow was complaining about missing modules.
We tried to work around this problem,
but it was a hack.
The latter was mainly because we were only distributing the bundled file.
This meant that any other web application that was depending on our library had to deal with our massive distribution file.
To better understand this problem,
imagine that you are working on an application that depends on d3.
Since d3 is also a dependency for pileup.js,
it makes sense to not bundle two d3s into a single file when transforming the code through browserify.
However, when pileup.js is already bundled together with its own dependencies,
d3 has to be bundled into the application once again,
causing redundancy in the production code and considerably inflating it.
Due to these problems,
we decided to uncouple the jstransform and browserify steps,
and start distributing the intermediate ES5 code to allow developers interact with our CommonJS-compatible module when desired.
Wrap up
Overall, after a few iterations of trial-and-error (and some level of frustration in between),
we are quite happy with the end result of our refactoring to improve the way we distribute pileup.js.
Thanks to these recent changes and the new structure of our module,
our library now plays nicely with online editors, such as JSFiddle:
In case you missed it in the previous blog post,
you can take a look at the public demo of pileup.js.
If you are looking for some example code to get inspiration for your web application,
our examples folder folder is a good place to start
If you bump into any issues using pileup.js in your application,
please let us know.
In this post we will introduce a class of frontend tests that cover more surface
area with less effort, as well as explain how to integrate them with continuous
integration using SauceLabs. Our
Cycledash project is over 75% covered
by unit tests, but this other class of test covers functionality and styling we
may miss with unit tests. We call these visual tests.
Visual Tests
Visual tests
take place in the browser, with the test client carrying out actions that a user
might perform. This is similar to typical
Selenium tests, except our focus isn’t
on asserting that certain elements exist or that an action can be carried
out. Instead, we take a screenshot at the end of each test, and compare it to
the golden master screenshot. The test fails if the actual screenshot differs
from this expected image even by a single pixel.
The advantage of visual tests is that they let you capture a lot of the UI and
underlying functionality of the application without explicitly enumerating all
the properties you would like to verify. This can manifest in, for example,
catching CSS or HTML regressions that couldn’t be caught by any reasonable
standard of unit tests. For example, changing the border of a div could reflow
an entire page’s layout; this change couldn’t be caught with a simple unit test,
but would be trivially caught by any visual test on the pages affected by this
change.
Our visual tests are written using
Seltest, a simple visual testing
framework written in Python that’s based on Selenium. Tests specify the URLs we
would like to hit and various interactions with those pages, such as filling in
a form or clicking a button. Each step of the test automatically takes a
screenshot of the current viewport, and compares it against a “golden master”
screenshot to see if anything has changed. If so, the test errors.
A small test suite could look something like the following.
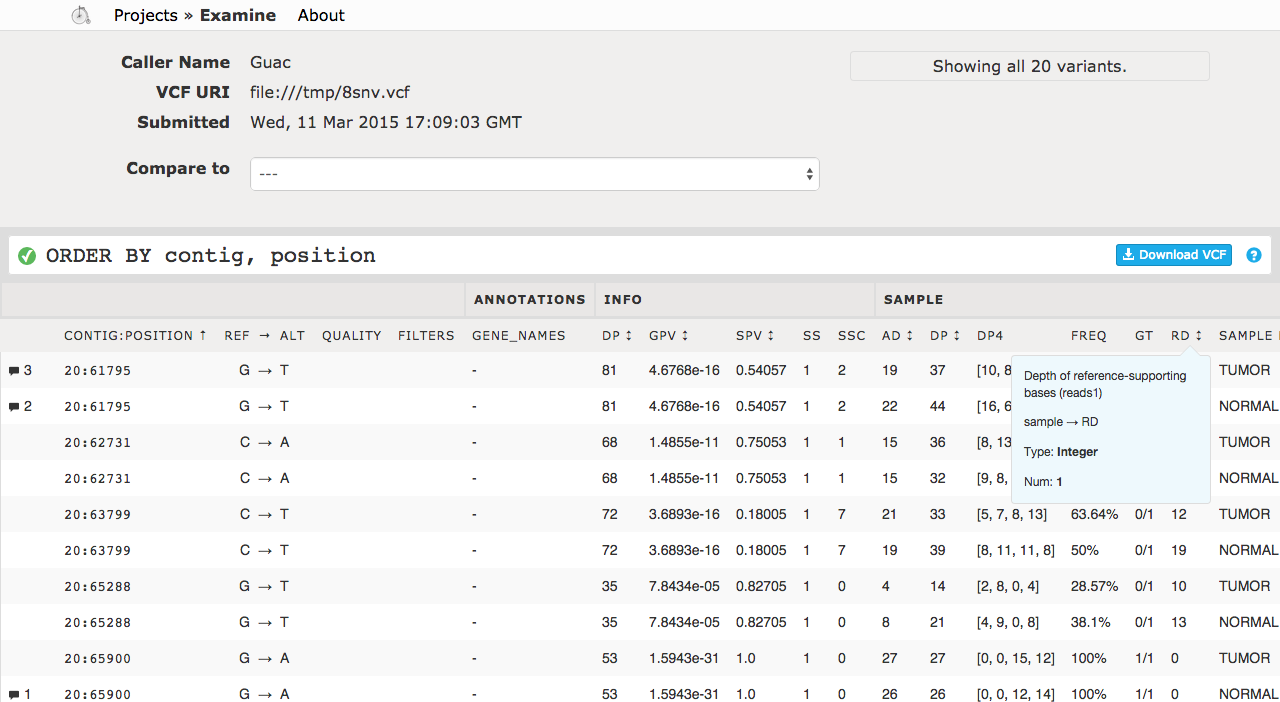
classExamine(seltest.Base):window_size=[1280,800]base_url=BASE+'/runs/1/examine'wait_for={'css_selector':'.query-status','classes':['good']}@waitfor('tr:first-child td:nth-child(20)',text='0')defsorted(self,driver):"""Examine page sorted by decreasing Normal Read Depth."""rd=driver.find_element_by_css_selector('[data-attribute="sample:RD"] a')rd.click()@waitfor('[data-attribute="info:DP"] .tooltip')deftooltip(self,driver):"""Examine page showing a Normal Read Depth tooltip."""dp=driver.find_element_by_css_selector('[data-attribute="sample:RD"]')hover=ActionChains(driver).move_to_element(dp)hover.perform()
The third test, tooltip, would generate the following screenshot from Cycledash.
These tests are run locally with Seltest’s
“update” command
to update the golden master screenshots, and remotely run with the “test”
command on Travis CI continuous integration in order
to verify that the screenshots being produced from a browser communicating with
the test server running on a Travis worker are the same as the golden masters
we’re expecting.
Cloud Chrome
One problem with these tests is that developers may be running their tests on
different operating systems or on different versions of the same browser. Even a
point release of an OS can result in slight differences between images. We’ve
seen an off-by-one pixel change when upgrading from OS X 10.9.2 to OS X
10.9.3. Additionally, running tests on a browser such as Chrome means trying to
keep a specific old version around that doesn’t auto-update. Even point releases
of an OS or browser can cause small visual changes.
Using a headless browser like PhantomJS ameliorates
some, but not all of these problems. For example, upgrading the operating system
as noted above resulted in visual differences even in Phantom. More importantly,
users aren’t actually using Phantom to navigate the web; they’re using Chrome or
Firefox. Issues arise in Phantom that never would in Chrome or Firefox, and vice
versa. Ideally, then, our tests will take place in a real browser.
One solution to this problem is driving a remote browser. In this way the
operating system and browser version can remain constant without any error-prone
local environment tweaking and maintenance. To do this we use SauceLabs, a
service which exposes an HTTP API to interact with a browser that Selenium-based
tests can drive. In this way we are able to precisely control, for every
developer and for our continuous integration server, the operating system and
browser version running our tests.
How We Do It
Our workflow for Cycledash has two main components: manually updating
screenshots, and automatically testing against them on our continuous
integration server.
Once a change has been made to the application, the developer updates
screenshots with a
simple script.
This script does three things:
Runs the Seltest update command, which executes the tests and updates the
golden master screenshots.
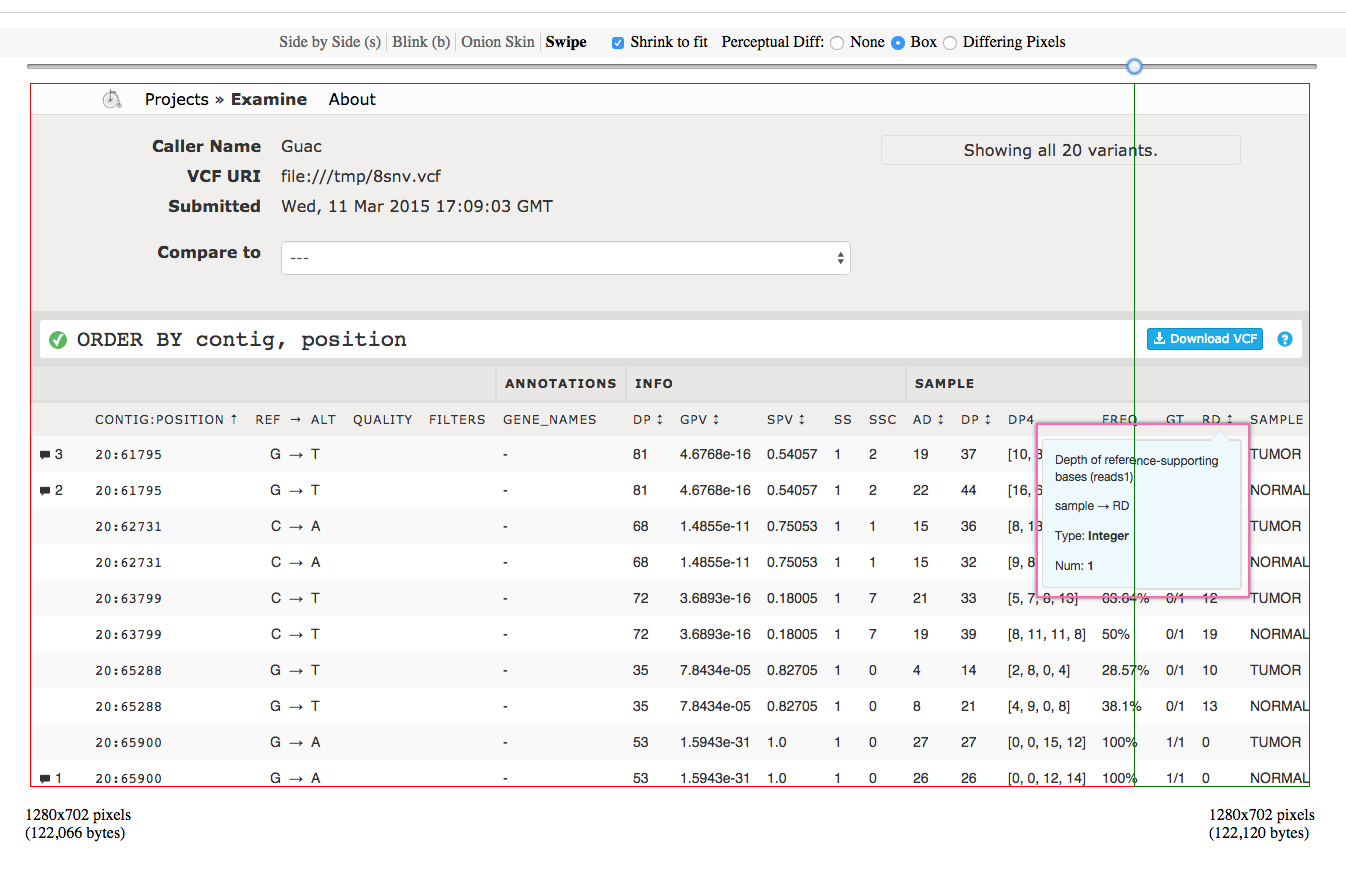
At this point, the new screenshots can be compared to the old ones using a
visual diff tool like Webdiff (the lab’s
favorite) to easily see that only what was expected to change has changed. In
the following screenshot, we can see that our change of the tooltip’s border
from 1px to 2px has been successfully caught.
Assuming that this change was intended, the developer would commit this new
golden master screenshot to git and push to GitHub. Travis CI would pull these
changes and run its usual linting and unit tests, and then the
Seltest tests
to ensure that the screenshots it is generating match those expected by the
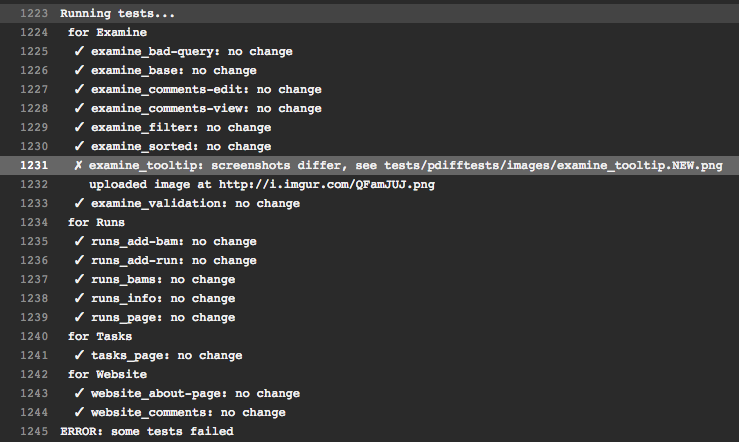
developer. If the screenshots hadn’t been updated in the above example, Travis
would fail with an error showing up in the logs like the following.
The Imgur screenshot is uploaded by Seltest for easy debugging. Additionally,
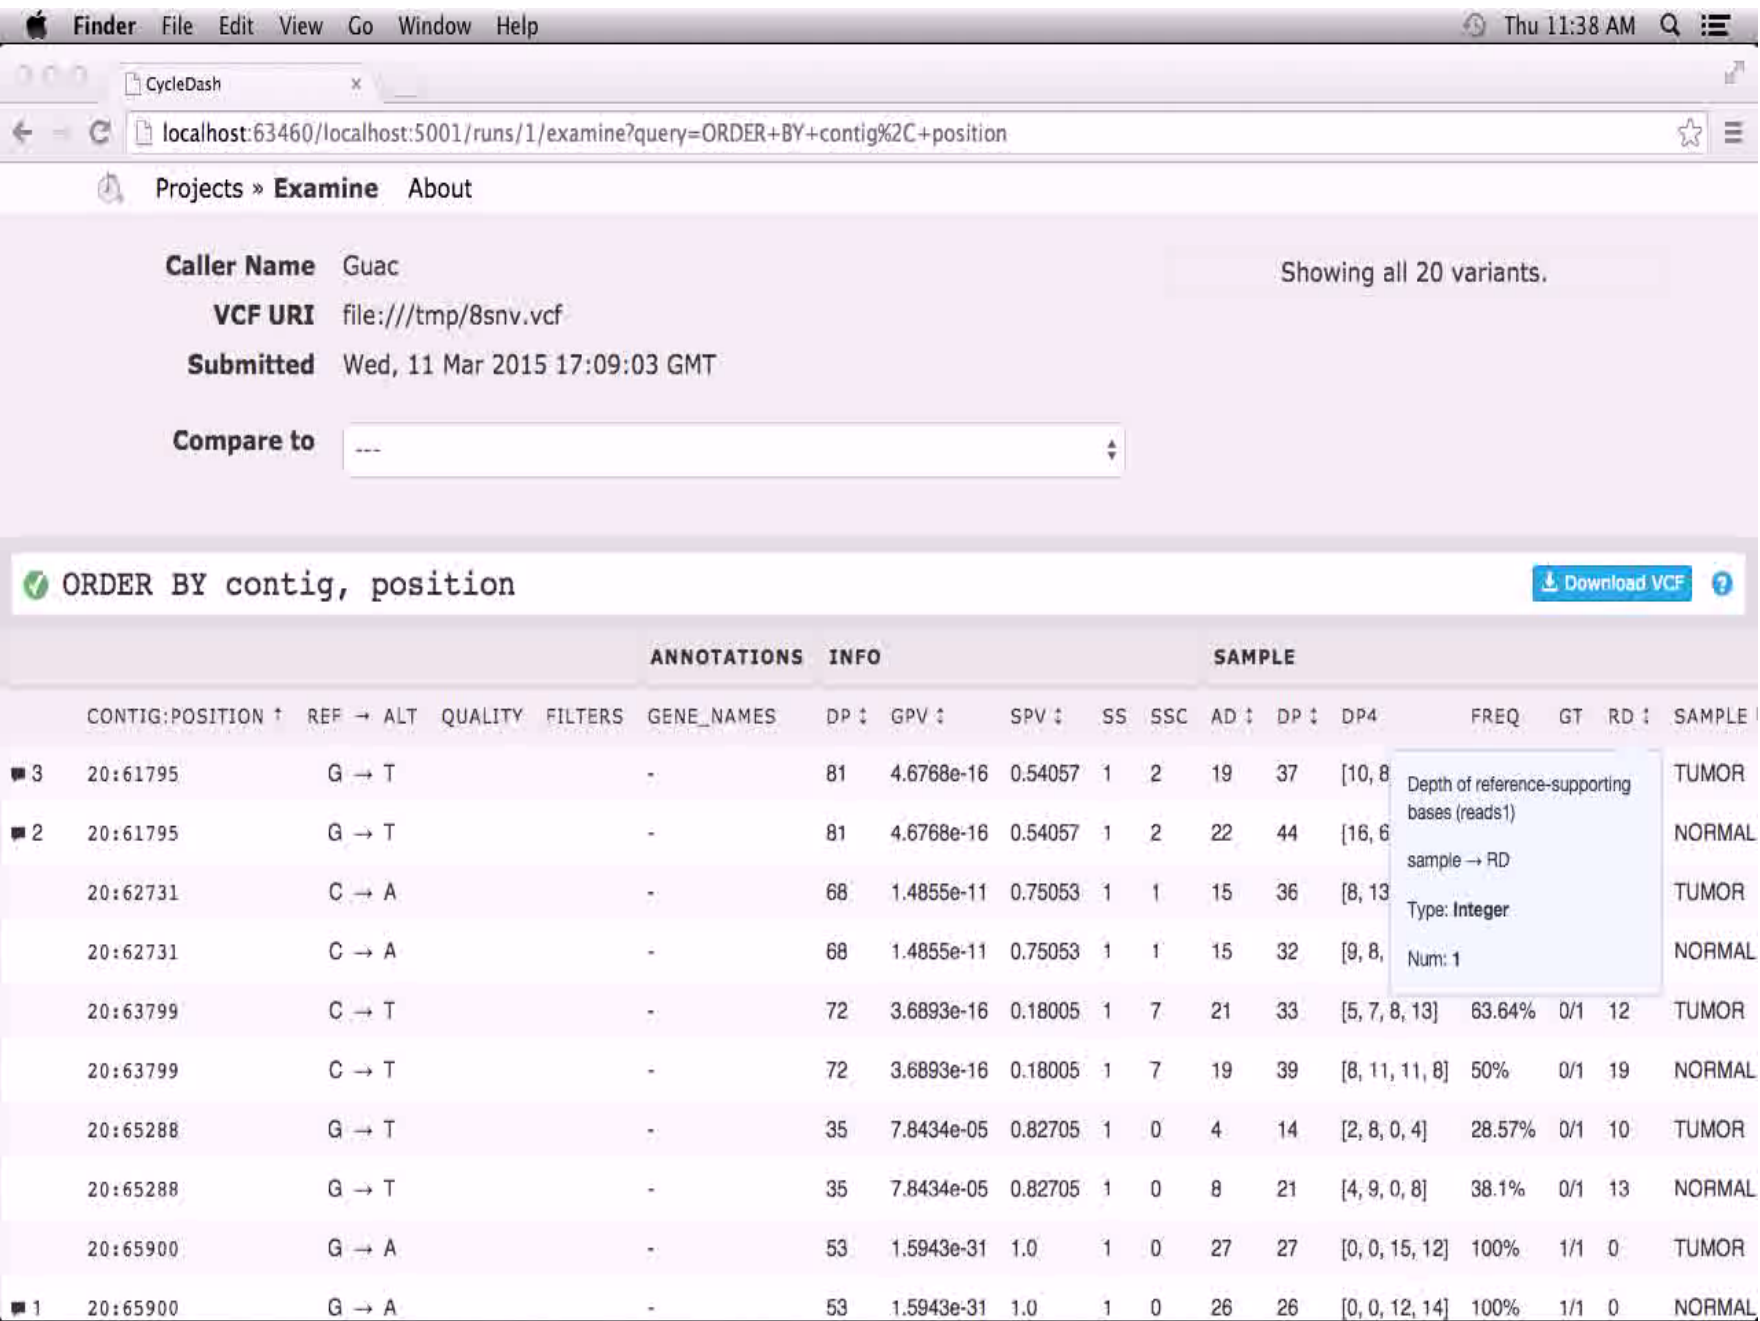
SauceLabs + Seltest give the developer several other options for debugging. One
can watch the tests execute remotely on SauceLabs; a screenshot of such a live
video follows. One can even interact with the browser directly, or can run
Seltest in interactive mode so that the developer can interact with the remote
browser programmatically from an IPython REPL.
The Final Word
This setup allows us to be confident that our changes aren’t unexpectedly
changing what someone interacting with our web application would see and
experience. And it lets us do it in a completely automated and programmatic
manner. This setup would work for mobile web applications, multiple browsers at
once, via
other headless or remote browser services,
and with any sort of web server.
Visual testing allows you to quickly cover large portions of your codebase and
catch visual errors without having to manually interaction with your web
server. Add in continuous integration and remote browsers, and you are now
automatically testing for visual regressions that you might not have been able
to catch before.
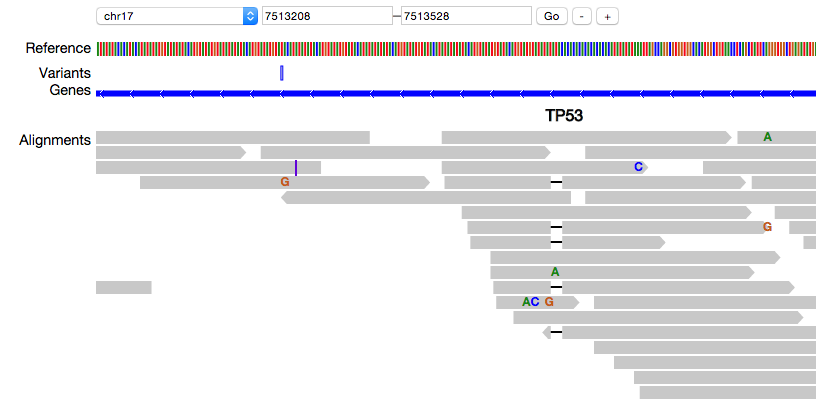
Over the past few months, we’ve developed pileup.js, a new genome viewer
designed for embedding within web applications. Try the demo!
While it’s still in the early stages of development, it can already load and
visualize data from a variety of sources:
(pileup.js showing the reference genome, variants, genes and a pileup view of alignments)
pileup.js was inspired by two existing genome browsers: Biodalliance and
IGV. Biodalliance is also designed to run in the browser, while IGV is a
standalone Java desktop application (though the IGV team has recently begun
work on a browser-based version, IGV.js).
pileup.js distinguishes itself from existing tools through the technical
decisions that went into its design. The JavaScript ecosystem has grown
tremendously over the past five years and creating a new genome browser from
scratch has allowed us to take advantage of modern tooling:
We use node-style modules via require and browserify. We pull in
third-party dependencies via npm.
We use Mocha for testing and coveralls.io for tracking code coverage. We
strive for very high test coverage: pileup.js is currently at 94%.
We use Facebook’s FlowType type annotation system to do static analysis
of our JavaScript. The public APIs are all well-annotated. Flow has helped us
find bugs quickly and improve the readability of our code.
In addition to modern tools, we’ve adopted several modern libraries:
We make extensive use of Promises (via Q). Promises are a major
improvement over the older callback style of asynchronous coding. They result
in clearer control flow and greater composability.
We use ReactJS to keep the various components of the pileup viewer in sync.
We use D3 to render the visualizations in SVG layers.
By using SVG, we allow the tracks to be styled and positioned using CSS. This
facilitates complex layouts and is more approachable for web developers than
custom styling systems.
While pileup.js is being developed primarily for use within CycleDash, we
expect that it will find uses in other web applications as well. The data
fetching/parsing logic and the display are fully separated, so a web app could
use pileup.js code to fetch BAM reads, for example, without rendering a
visualization.
This is part of a broader goal of moving away from “bespoke” genomic file
formats like BAM and VCF and towards entities which can be stored and
served by non-filesystems, e.g. Impala or GA4GH.
You can learn more about pileup.js on GitHub or NPM.
Future areas for work include:
Improving performance. While load times and frame rates while panning are
acceptable today, we’d like to improve both in the future.
This may require switching the rendering layer from SVG to canvas or WebGL.
Adding more visualizations, for example read depth for alignment tracks or
gene expression data.
Factoring out the data-fetching code into a separate NPM package for easier
reuse.
Please give pileup.js a try and let us know what you think. The best way to
give feedback is through our issue tracker.
Quick experience report on our adventures running old-school
batch-processing-style computational workflows on a YARN-managed Hadoop
cluster.
Ketrew on YARN
We run a whole lot of bioinformatics software artifacts in the form of long
pipelines of finely tuned analysis steps.
The project
hammerlab/biokepi
is our repository of bioinformatics workflows; it
uses
Ketrew
as a workflow engine and exposes a high-level Lego-style pipeline building API
in OCaml.
Biokepi is quite agnostic of the computing environment; any Ketrew backend with
a shared filesystem can be used, by creating a
Run_environment.Machine.t.
In house, we want to use our Hadoop cluster. Nowadays the Hadoop ecosystem is
using the
YARN
scheduler. Ketrew gained support for YARN a
few months ago,
and this got into the
1.0.0 release that
recently hit the shelves.
Ketrew has to be able to run both Hadoop applications (with built-in knowledge
of YARN resources) and arbitrary programs (like classical batch-application
clusters).
The implementation in
ketrew_yarn.ml
provides both.
Running YARN-enabled Hadoop applications is just a matter of daemonizing their
“master process” on one of the cluster’s login-nodes. This process will then
request resources from YARN.
To run arbitrary programs we had to wrap them within the cutely named
org.apache.hadoop.yarn.applications.distributedshell.Clientclass;
it runs the “application master” that requests (part of) a cluster node
from YARN, to then launch the given shell script.
Once this was implemented, there were a few more obstacles yet to kick through.
Actually Making It Work
A Hadoop cluster is built around a non-POSIX distributed filesystem:
HDFS.
Most bioinformatics tools won’t know about HDFS, and will assume a good old
Unix-based filesystem access.
Luckily, we have a decent NFS mount configured.
The gods of distributed computing won’t let you use NFS without cursing you;
this time it was the user IDs.
YARN’s default behavior is to run “containers” as the yarn Unix-user (a
container is a unit of computational resources; like a core of a node in the
cluster), hence all the POSIX files created by bioinformatics tools would be
manipulated by the yarn user.
The first hacky attempt was to clumsily chmod 777 everything, with a
permissive umask, and hope that the yarn user will be able to read and
write.
Nope.
Of course, NFS is based on UIDs not usernames, the user yarn has
different UIDs on different nodes of the cluster (which can be seen as a
misconfiguration bug).
A given step of the pipeline will write files
as the user 42 and a latter one, on a different node, will try to write as
51 … even with a lot of black magic chmod/setfacl incantations, we end up
with pipelines failing after a few hours and leaving terabytes of unusable files on
our then inconsistent NFS mount.
To save our poor souls, there just so happens to be something called “YARN
Security.”
The scheduler can be configured to run the containers as the Unix user that
started the application, just like other schedulers have been doing for the past
30 years
(cf.
documentation).
After updating to the latest Cloudera distribution to enjoy a few bug fixes, it
finally works!
We’ve been running hundreds of CPU-hours of bioinformatics pipelines,
generating terabytes of data,
and posting results to our instance of
hammerlab/cycledash.
Next Steps
Always outnumbered never outgunned, we’re now working on:
Getting more run-time information from YARN (issue
hammerlab/ketrew#174): So
far we get basic “application status information” from YARN as well as post
mortem application logs. We want to show in Ketrew’s UI more real-time
information, especially the logs of the cluster node running the
YARN-container.
Improving Biokepi to become a “production ready” pipeline framework. This
means adding more tools, improving configurability and scalability; cf.
hammerlab/biokepi/issues.
Since everyone loves to read about code coverage, we figured we’d describe
how we implemented it for a language only 97.3% as popular as JavaScript:
OCaml! No matter how functional our approach to implementing Ketrew,
our eDSL for managing workflows, at the end of the day the program needs to
manage state. From that perspective, code coverage helps you to be sure that
you’ve tested all the ways you manage that state, and probably more importantly
what paths you’ve implemented but haven’t tested.
OCaml Code Coverage Tools
We considered a couple of options when trying to implement code coverage for
OCaml.
MLCov works by patching the OCaml compiler. Unfortunately, the latest
version (as of 2010-11-24) works against the 3.12 version.
ZAMCOV is advertised as a modified OCaml virtual machine that runs your
source code and tracks execution. Unfortunately, it also targets
version 3.12. Both of these methods seem outdated and do not
provide the necessary flexibility with updating versions.
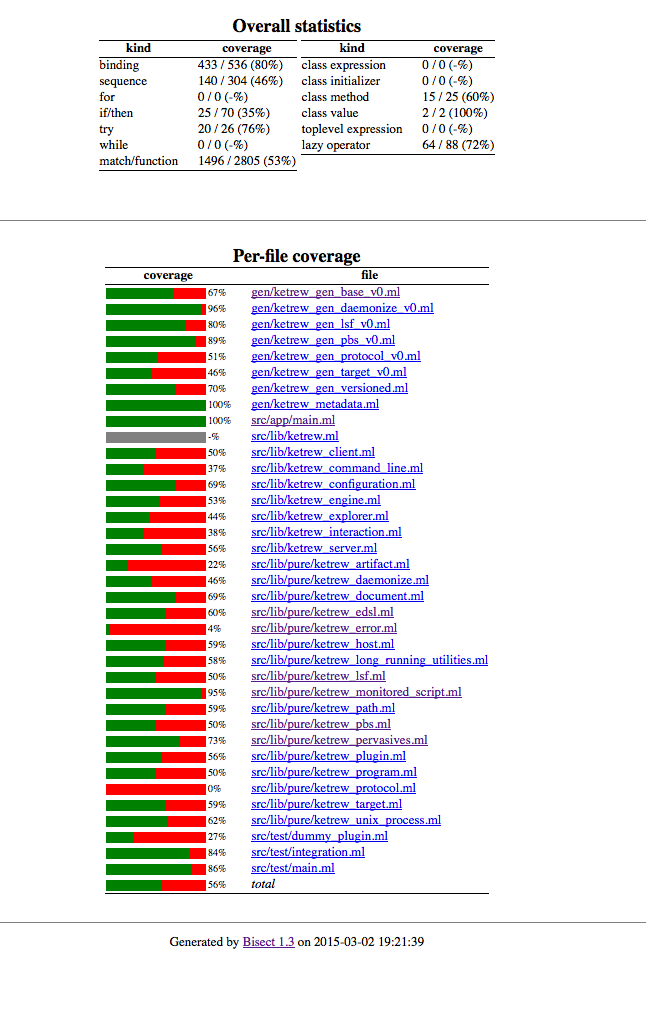
Bisect works by first instrumenting the code via Camlp4, and then
linking a library that keeps track of the executed code paths.
Finally, an executable bisect-report can be used to generate a
pretty annotated webpage.
Relying on Camlp4 certainly gives us some pause due to the move
towards extension points in 4.02, but this seems like the most
up to date method.
Of course, it is important to be able to control the instrumentation so that
production versions do not have this book-keeping. Therefore, we’d like to
integrate this capability with our current build tool.
Oasis’s strengths lie in its ability to succinctly
represent what you’re trying to build in a way that understands OCaml.
If you want to build a library, add a library section; if you want an executable,
add an executable section; if you want a test, etc. Oasis does a good job of exposing the
appropriate options (such as dependencies, filenames, install flags) for
building each of these things, but it is not flexible in how to build these
things. Let’s get to the details.
Add a Flag section to the _oasis file to allow you to optionally instrument
code:
Flag coverage
  Description: Use Bisect to generate coverage data.
  Default:     false
Unfortunately using this flag in the _oasis file to logically represent two
compilation paths is almost impossible. For example, we cannot use BuildDepends.
Adding
  if flag(coverage)
    BuildDepends: bisect
  else
    BuildDepends:
throws up an error: Exception: Failure "Field 'BuildDepends' cannot be
conditional". One could create separate build targets for instrumented
executables because the Build flag is conditional. But then you would have to
duplicate the build chain for all of your intermediary steps, such as libraries,
by adding instrumented versions of those. But even if you were successful at
that, passing the preprocessing arguments to Ocamlbuild via the
XOCamlbuildExtraArgs is settable only in the project scope and you have to
pass different arguments to different targets (Library vs Executable).
So for now, add the Flag section: this lets you configure your project with
coverage via ocaml setup.ml -configure --enable-coverage by modifying
the setup.data text file that is used during compilation.
To perform the instrumentation we’ll drop down a layer into the OCaml build
chain.
Oasis uses OCamlbuild for the heavy lifting. Besides knowing how to build OCaml
programs well and performing it ‘hygienically’ in a separate _build
directory, OCamlbuild is also highly configurable with a _tags file and a
plugin mechanism via myocamlbuild.ml that supports a rich API. One can write
custom OCaml code to execute and determine options; exactly what we need.
It makes sure all the source code passes through the bisect preprocessor
(bisect_pp.cmo).
Executables (because of the program flag) are linked against the Bisect
object file that collects the execution points. The function has_coverage
checks that the line coverage="true" is present in setup.data.
Lastly, the format of that dispatch makes sure we use ocamlfind when
looking for packages.
Reports
We can add some targets to our Makefile to generate reports:

 (Our current workflow for developing and distributing the